
| Version 15 (modified by , 11 years ago) (diff) |
|---|
IG-MON-4: Infrastructure Device Performance Test
This page captures status for the test case IG-MON-4, which verifies that the rack head node performs well enough to run all the services it needs to run while OpenFlow and non-OpenFlow experiments are running. For overall status see the InstaGENI Acceptance Test Status page.
Last update: 2013/01/29
Test Status
This section captures the status for each step in the acceptance test plan.
| Step | State | Ticket | Notes |
| Step 1 | |||
| Step 2 | |||
| Step 3 |
| State Legend | Description |
| Color(green,Pass)? | Test completed and met all criteria |
| Color(#98FB98,Pass: most criteria)? | Test completed and met most criteria. Exceptions documented |
| Color(red,Fail)? | Test completed and failed to meet criteria. |
| Color(yellow,Complete)? | Test completed but will require re-execution due to expected changes |
| Color(orange,Blocked)? | Blocked by ticketed issue(s). |
| Color(#63B8FF,In Progress)? | Currently under test. |
Test Plan Steps
This test cases sets up several experiments to generate resource usage for both compute and network resources in an InstaGENI Rack. The rack used is the GPO rack and the following experiments are set up before head node device performance is reviewed:
- IG-MON-4-exp1: IG GPO non-OpenFlow experiment with 10 VM nodes, all nodes exchanging traffic.
- IG-MON-4-exp2: IG GPO non-OpenFlow experiment with 1 VM and one dedicated raw-pc, both exchanging traffic.
- IG-MON-4-exp3: IG GPO OpenFlow experiment with 2 nodes in rack exchanging traffic with 2 site GPO OpenFlow campus resources.
- IG-MON-4-exp4: IG GPO OpenFlow experiment with 4 nodes exchanging traffic within the GPO rack.
The setup of the experiments above is not captured in this test case, but the RSpec are available [insert_link_here]. Also traffic levels and types will be captured when this test is run.
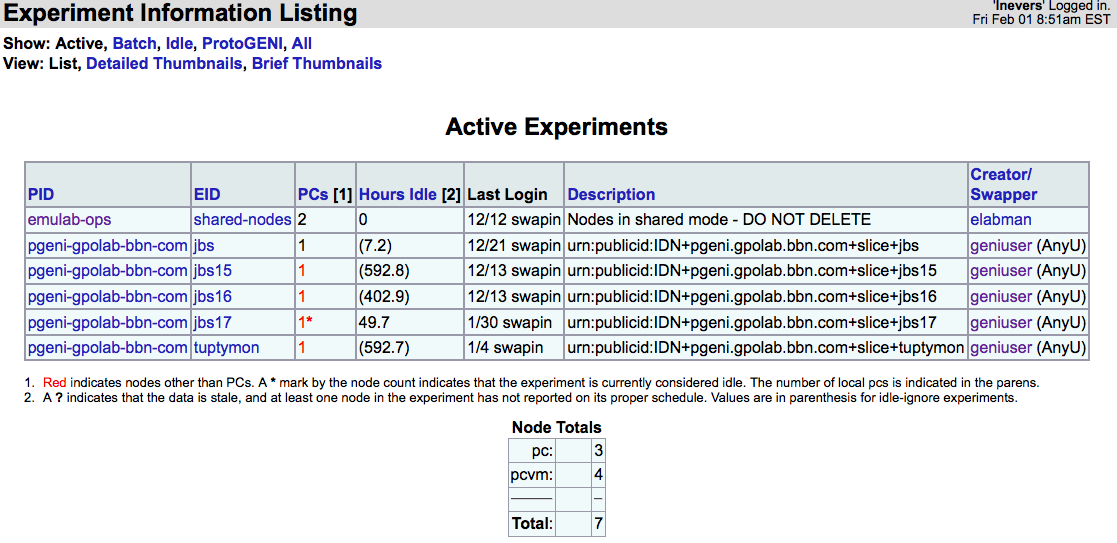
In addition to the 4 experiment listed above the following experiments were running on the GPO IG rack: [Insert_capture for https://boss.instageni.gpolab.bbn.com/showexp_list.php3]
While the 4 experiments involving OpenFlow and compute slivers are running, execute the steps below.
1. View OpenFlow control monitoring at GMOC
Before starting any experiments that request compute or network resources, collected information for baseline performance for the GPO rack for the boss, FlowVisor and FOAM nodes.
Checked existing experiments within the rack:

Node allocation by node type:

Top statistics for boss node:
last pid:  9133;  load averages:  0.02,  0.03,  0.00   up 51+16:06:27  09:09:23
140 processes: 1 running, 138 sleeping, 1 zombie
CPU:  0.0% user,  0.0% nice,  0.5% system,  0.0% interrupt, 99.5% idle
Mem: 369M Active, 1313M Inact, 187M Wired, 8632K Cache, 93M Buf, 123M Free
Swap: 2047M Total, 2628K Used, 2045M Free
The above shows the boss node CPU Load averages:
- 1 minutes: 0.02
- 5 minutes: 0.03
- 15 minutes: 0.00
Top statistics for FOAM node:
top - 09:16:02 up 49 days, 21:19,  2 users,  load average: 0.17, 0.12, 0.08
Tasks:  71 total,   1 running,  68 sleeping,   0 stopped,   2 zombie
Cpu(s): 17.6%us,  6.0%sy,  0.0%ni, 76.4%id,  0.0%wa,  0.0%hi,  0.0%si,  0.0%st
Mem:    756268k total,   613788k used,   142480k free,   149172k buffers
Swap:   794620k total,     4444k used,   790176k free,   334824k cached
The above shows the boss node CPU Load averages:
- 1 minutes: 0.17
- 5 minutes: 0.12
- 15 minutes: 0.08
Checked for existing FOAM sliver (also shown in the EID column of the "Active Nodes" above:
lnevers@foam:~$ foamctl geni:list-slivers --passwd-file=/etc/foam.passwd |grep sliver_urn
   "sliver_urn": "urn:publicid:IDN+pgeni.gpolab.bbn.com+slice+jbs15:8a0abd6f-0f5a-469f-91d2-c7f990b8494e",
   "sliver_urn": "urn:publicid:IDN+pgeni.gpolab.bbn.com+slice+jbs16:a92990b6-1ede-4dd7-b6f6-7b4a4bd36fd7",
   "sliver_urn": "urn:publicid:IDN+pgeni.gpolab.bbn.com+slice+tuptymon:b7850c93-110f-4e63-a121-26f3449dac44",
   "sliver_urn": "urn:publicid:IDN+pgeni.gpolab.bbn.com+slice+jbs17:fd82bb82-eef3-407d-b092-c1393773791c",
Top statistics for FlowVisor node:
top - 09:16:32 up 49 days, 16:24,  2 users,  load average: 0.00, 0.01, 0.05
Tasks:  68 total,   1 running,  67 sleeping,   0 stopped,   0 zombie
Cpu(s):  0.0%us,  0.2%sy,  0.0%ni, 99.8%id,  0.0%wa,  0.0%hi,  0.0%si,  0.0%st
Mem:   4031252k total,   964924k used,  3066328k free,    92380k buffers
Swap:  4202492k total,        0k used,  4202492k free,   364268k cached
The above shows the boss node CPU Load averages:
- 1 minutes: 0.00
- 5 minutes: 0.01
- 15 minutes: 0.05
Checked for existing FlowSpace rules:
lnevers@flowvisor:~$ fvctl --passwd-file=/etc/flowvisor.passwd listFlowSpace
Got reply:
rule 0: FlowEntry[dpid=[06:d6:84:34:97:c6:c9:00],ruleMatch=[OFMatch[dl_type=0x800,nw_dst=10.42.15.0/24,nw_src=10.42.15.0/24]],actionsList=[Slice:8a0abd6f-0f5a-469f-91d2-c7f990b8494e=4],id=[13],priority=[2000],]
rule 1: FlowEntry[dpid=[06:d6:84:34:97:c6:c9:00],ruleMatch=[OFMatch[dl_type=0x806,nw_dst=10.42.15.0/24,nw_src=10.42.15.0/24]],actionsList=[Slice:8a0abd6f-0f5a-469f-91d2-c7f990b8494e=4],id=[14],priority=[2000],]
rule 2: FlowEntry[dpid=[06:d6:84:34:97:c6:c9:00],ruleMatch=[OFMatch[dl_type=0x800,nw_dst=10.42.16.0/24,nw_src=10.42.16.0/24]],actionsList=[Slice:a92990b6-1ede-4dd7-b6f6-7b4a4bd36fd7=4],id=[15],priority=[2000],]
rule 3: FlowEntry[dpid=[06:d6:84:34:97:c6:c9:00],ruleMatch=[OFMatch[dl_type=0x806,nw_dst=10.42.16.0/24,nw_src=10.42.16.0/24]],actionsList=[Slice:a92990b6-1ede-4dd7-b6f6-7b4a4bd36fd7=4],id=[16],priority=[2000],]
rule 4: FlowEntry[dpid=[06:d6:84:34:97:c6:c9:00],ruleMatch=[OFMatch[dl_type=0x800,nw_dst=10.50.0.0/16,nw_src=10.50.0.0/16]],actionsList=[Slice:b7850c93-110f-4e63-a121-26f3449dac44=4],id=[21],priority=[2000],]
rule 5: FlowEntry[dpid=[06:d6:84:34:97:c6:c9:00],ruleMatch=[OFMatch[dl_type=0x806,nw_dst=10.50.0.0/16,nw_src=10.50.0.0/16]],actionsList=[Slice:b7850c93-110f-4e63-a121-26f3449dac44=4],id=[22],priority=[2000],]
rule 6: FlowEntry[dpid=[06:d6:84:34:97:c6:c9:00],ruleMatch=[OFMatch[dl_type=0x800,nw_dst=10.42.17.0/24,nw_src=10.42.17.0/24]],actionsList=[Slice:fd82bb82-eef3-407d-b092-c1393773791c=4],id=[50],priority=[2000],]
rule 7: FlowEntry[dpid=[06:d6:84:34:97:c6:c9:00],ruleMatch=[OFMatch[dl_type=0x806,nw_dst=10.42.17.0/24,nw_src=10.42.17.0/24]],actionsList=[Slice:fd82bb82-eef3-407d-b092-c1393773791c=4],id=[51],priority=[2000],]
lnevers@flowvisor:~$
2. View VLAN 1750 data plane monitoring
Verify the VLAN 1750 data plane monitoring which pings the rack's interface on VLAN 1750, and verify that packets are not being dropped
3. Verify CPU idle percentage on the server host and the FOAM VM are both nonzero
Additional Scenarios
This section captures some scenarios that are not in the original test plan, but have been captured as a data point for performance.
Mix of non-OF experiments
The first head node monitoring scenario was captured while the rack had 27 nodes allocated:
Head node the system was mostly idle:
[lnevers@boss ~]$ top
last pid:  6455;  load averages:  0.05,  0.11,  0.13                                               up 48+22:16:24  15:19:20
140 processes: 1 running, 138 sleeping, 1 zombie
CPU:  0.0% user,  0.0% nice,  0.0% system,  0.0% interrupt,  100% idle
Mem: 384M Active, 1241M Inact, 187M Wired, 25M Cache, 93M Buf, 162M Free
Swap: 2047M Total, 2420K Used, 2045M Free

[lnevers@boss ~]$ ps -eao pcpu,pid,user,args | sort -r -k1
 %CPU   PID USER    COMMAND
  0.0 95092 elabman /usr/X11R6/bin/bash --noediting -i
  0.0 95089 elabman /usr/X11R6/bin/bash --noediting -i
  0.0 95086 elabman /usr/X11R6/bin/bash --noediting -i
  0.0 95084 elabman /usr/X11R6/bin/bash --noediting -i
  0.0 95083 elabman /usr/X11R6/bin/bash --noediting -i
  0.0 95045 elabman dbus-launch --autolaunch=05f048b1db6b246dc4dcc41b00014cac --binary-syntax --close-stderr
  0.0 95028 elabman emacs
  0.0 94997 elabman bash -login
  0.0 91498 elabman bash -login
  0.0 90045 elabman bash -login
  0.0 84248 elabman ssh pc1
  0.0 83886 elabman bash -login
  0.0 68989 elabman mysql geni-cm
  0.0 55878 elabman emacs
  0.0 49903 root    tcppd (perl5.12.4)
  0.0 39666 elabman mysql tbdb
  0.0 38352 elabman mysql tbdb
  0.0 33963 elabman /usr/X11R6/bin/bash --noediting -i
  0.0 33959 elabman /usr/X11R6/bin/bash --noediting -i
  0.0 33956 elabman /usr/X11R6/bin/bash --noediting -i
  0.0 33954 elabman /usr/X11R6/bin/bash --noediting -i
  0.0 33953 elabman /usr/X11R6/bin/bash --noediting -i
  0.0 25286 elabman emacs -nw GeniCM.pm.in
  0.0 16663 elabman bash -login
  0.0  7518 lnevers sort -r -k1
  0.0  7517 lnevers ps -eao pcpu,pid,user,args
  0.0  6453 lnevers bash
  0.0  6448 lnevers -tcsh (tcsh)
  0.0  1709 root    /usr/libexec/getty std.115200 console
[lnevers@boss ~]$ uptime
 3:27PM  up 48 days, 22:25, 6 users, load averages: 0.17, 0.18, 0.15
[lnevers@boss ~]$ iostat
       tty             da4              da1              da2             cpu
 tin  tout  KB/t tps  MB/s   KB/t tps  MB/s   KB/t tps  MB/s  us ni sy in id
   0     3 26.01   0  0.01  20.72   0  0.00   7.91   1  0.01   1  0  1  0 98
Similar results on the OPS node:
last pid: 22804;  load averages:  0.10,  0.06,  0.01                                               up 48+22:20:45  15:23:31
107 processes: 1 running, 106 sleeping
CPU:  0.8% user,  0.0% nice,  0.4% system,  0.0% interrupt, 98.8% idle
Mem: 166M Active, 871M Inact, 147M Wired, 8460K Cache, 95M Buf, 808M Free
Swap: 2047M Total, 852K Used, 2046M Free

[lnevers@ops ~]$ ps -eao pcpu,pid,user,args | sort -r -k1
 %CPU   PID USER    COMMAND
  0.0 98491 elabman bash -login
  0.0 23097 lnevers sort -r -k1
  0.0 23096 lnevers ps -eao pcpu,pid,user,args
  0.0 23059 lnevers bash
  0.0 23054 lnevers -tcsh (tcsh)
  0.0   779 root    /usr/libexec/getty std.115200 console
  0.0   597 mysql   /usr/local/libexec/mysqld --basedir=/usr/local --datadir=/var/db/mysql --user=mysql --pid-file=/var/db/
  0.0   530 root    /bin/sh /usr/local/bin/mysqld_safe --pid-file=/var/db/mysql/mysqld.pid --user=mysql --log-long-format -
[lnevers@ops ~]$ uptime
 3:29PM  up 48 days, 22:27, 2 users, load averages: 0.28, 0.13, 0.04
[lnevers@ops ~]$ iostat
       tty             da3              da0              da4             cpu
 tin  tout  KB/t tps  MB/s   KB/t tps  MB/s   KB/t tps  MB/s  us ni sy in id
   0     1 20.32   0  0.00  11.07   0  0.01  11.09   0  0.00   0  0  0  0 100
On the FOAM node:
lnevers@foam:~$ top
top - 16:04:39 up 47 days,  4:08,  2 users,  load average: 0.00, 0.01, 0.05
Tasks:  67 total,   1 running,  64 sleeping,   0 stopped,   2 zombie
Cpu(s):  0.3%us,  0.0%sy,  0.0%ni, 99.7%id,  0.0%wa,  0.0%hi,  0.0%si,  0.0%st
Mem:    756268k total,   587192k used,   169076k free,   147864k buffers
Swap:   794620k total,     4444k used,   790176k free,   317560k cached

lnevers@foam:~$ ps -eao pcpu,pid,user,args | sort -r -k1
%CPU   PID USER     COMMAND
 0.6 12890 lnevers  bash
 0.1 12758 lnevers  -bash
 0.0     9 root     [khelper]
 0.0     8 root     [cpuset]
 0.0  8674 root     /sbin/getty -L hvc0 9600 linux
 0.0  8544 root     /usr/sbin/sshd -D
 0.0     7 root     [watchdog/0]
 0.0     6 root     [migration/0]
 0.0  6866 www-data /usr/bin/python /opt/foam/sbin/foam.fcgi
 0.0  6858 www-data nginx: worker process
 0.0  6857 www-data nginx: worker process
 0.0  6856 www-data nginx: worker process
 0.0  6855 www-data nginx: worker process
 0.0  6854 root     nginx: master process /usr/sbin/nginx
 0.0   642 root     /sbin/getty -8 38400 tty1
 0.0   610 daemon   atd
 0.0   609 root     cron
 0.0   606 root     /sbin/getty -8 38400 tty6
 0.0   602 root     /sbin/getty -8 38400 tty3
 0.0   600 root     /sbin/getty -8 38400 tty2

lnevers@foam:~$ uptime
 16:06:12 up 47 days,  4:10,  2 users,  load average: 0.04, 0.03, 0.05
lnevers@foam:~$ iostat
Linux 3.2.0-34-generic (foam) 	01/29/2013 	_x86_64_	(1 CPU)

avg-cpu:  %user   %nice %system %iowait  %steal   %idle
           0.60    0.00    0.33    0.00    0.00   99.06

Device:            tps    kB_read/s    kB_wrtn/s    kB_read    kB_wrtn
xvda              1.71         0.09        13.25     370717   54001250
dm-0              2.39         0.09        13.25     366389   53996104
dm-1              0.00         0.00         0.00       2324       5104
Attachments (1)
- IG-MON-4-pre-exp.jpg (584.7 KB) - added by 11 years ago.
Download all attachments as: .zip