
| Version 17 (modified by , 10 years ago) (diff) |
|---|
2. Instrument your Application using LabWiki
In this part you will learn how you can use LabWiki to execute an experiment on the slice you
reserved earlier today.
If for any reason you do not have resources from the earlier tutorial, open jFed, click OpenURL and use the Rspec at following URL to reserve resources http://emmy9.casa.umass.edu/FGRE2014/firstlwexp.xml.
2.1 Design and Execute measurement in LabWiki
2.1.1. The "Plan" Window
To get started point your browser to http://labwiki.test.atlantis.ugent.be:4000. Labwiki has three major windows. We will focus on the leftmost window first. This is the "Planning" window in which you document your experiment. (This is somewhat the equivalent of an electronic lab journal.) Documents are written in Markdown.
At the top of that window is a text field which you can use to search for existing MD scripts. Type "firegenipart0" in the field and then select "firegenipart0.md" from the list of files that are offered. This document has some information on the experiment that will be performed in the tutorial.
The entire Markdown script is shown here for your reference:
# My First Application
Today, we will write a simple script to automate tests such as Ping and Iperf using LabWiki
Overall we will do the following:
* Define OEDL script for ping and Iperf
* Run Experiment in LabWiki and view Graphs
## My Topology
<img src="http://emmy9.casa.umass.edu/FGRE2014/part0_topo.png" width="100%" height="100%">
## Define Property
Example:
defProperty('source1', "client-lwtest6", "ID of a resource")
## Define Application
<pre><code>
defApplication('ping') do |app|
app.description = 'Simple Definition for the ping-oml2 application'
# Define the path to the binary executable for this application
app.binary_path = '/usr/local/bin/ping-oml2'
# Define the configurable parameters for this application
# For example if target is set to foo.com and count is set to 2, then the
# application will be started with the command line:
# /usr/bin/ping-oml2 -a foo.com -c 2
app.defProperty('target', 'Address to ping', '-a', {:type => :string})
app.defProperty('count', 'Number of times to ping', '-c', {:type => :integer})
# Define the OML2 measurement point that this application provides.
# Here we have only one measurement point (MP) named 'ping'. Each measurement
# sample from this MP will be composed of a 4-tuples (addr,ttl,rtt,rtt_unit)
app.defMeasurement('ping') do |m|
m.defMetric('dest_addr',:string)
m.defMetric('ttl',:uint32)
m.defMetric('rtt',:double)
m.defMetric('rtt_unit',:string)
end
end
</code></pre>
## Experiment
* Define Traffic Controller
* Define Application Events
## Iperf Graphs
a) Nymber of Bytes

__Figure 1__. Total number of Bytes
## Ping Graph

__Figure 2__. Round-trip Time.
2.1.2 The "Prepare" Window
This window allows us to create and edit script, both Markdown and OEDL.
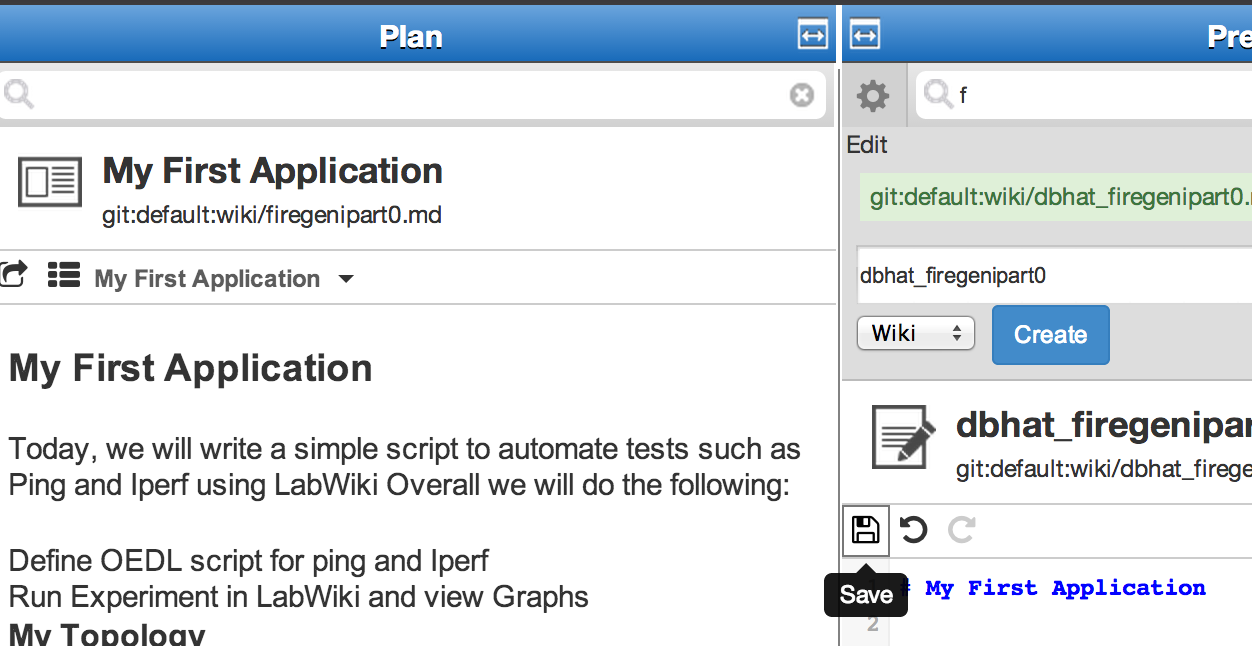
We will now edit the Markdown script described above. Click and Drag the icon from the Plan to the Prepare window as shown here:

Copy the contents of the Prepare Window (Keyboard shortcuts will work here).

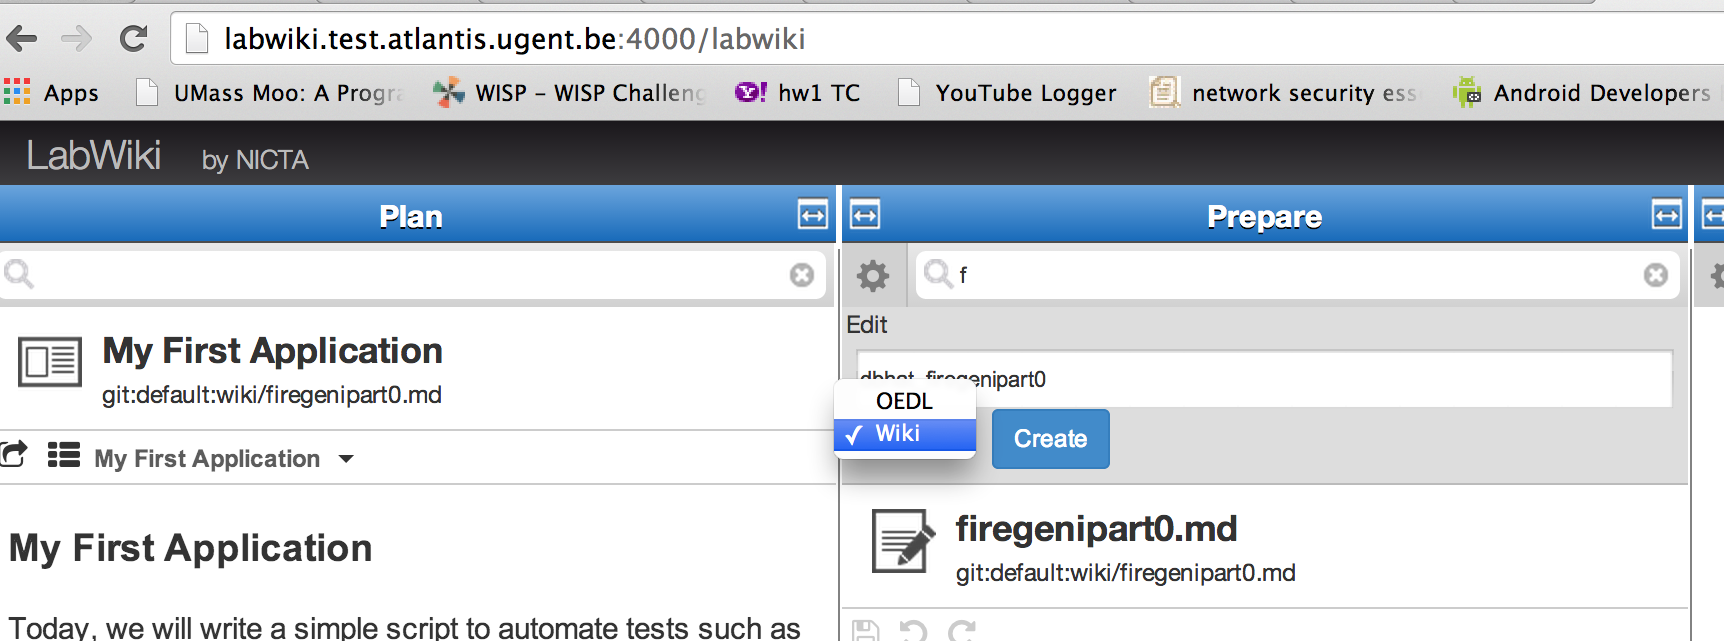
Create a new script by clicking on the wheel at the top of the Prepare Window, prepend your username to the name of the script and select Wiki from the drop down menu next to the "Create" button. Paste the contents of firegenipart0.md to create a copy of your own.
Note: Please do not modify the original script. As an example, my script is called "dbhat_firegenipart0.md".
Click on Save icon.

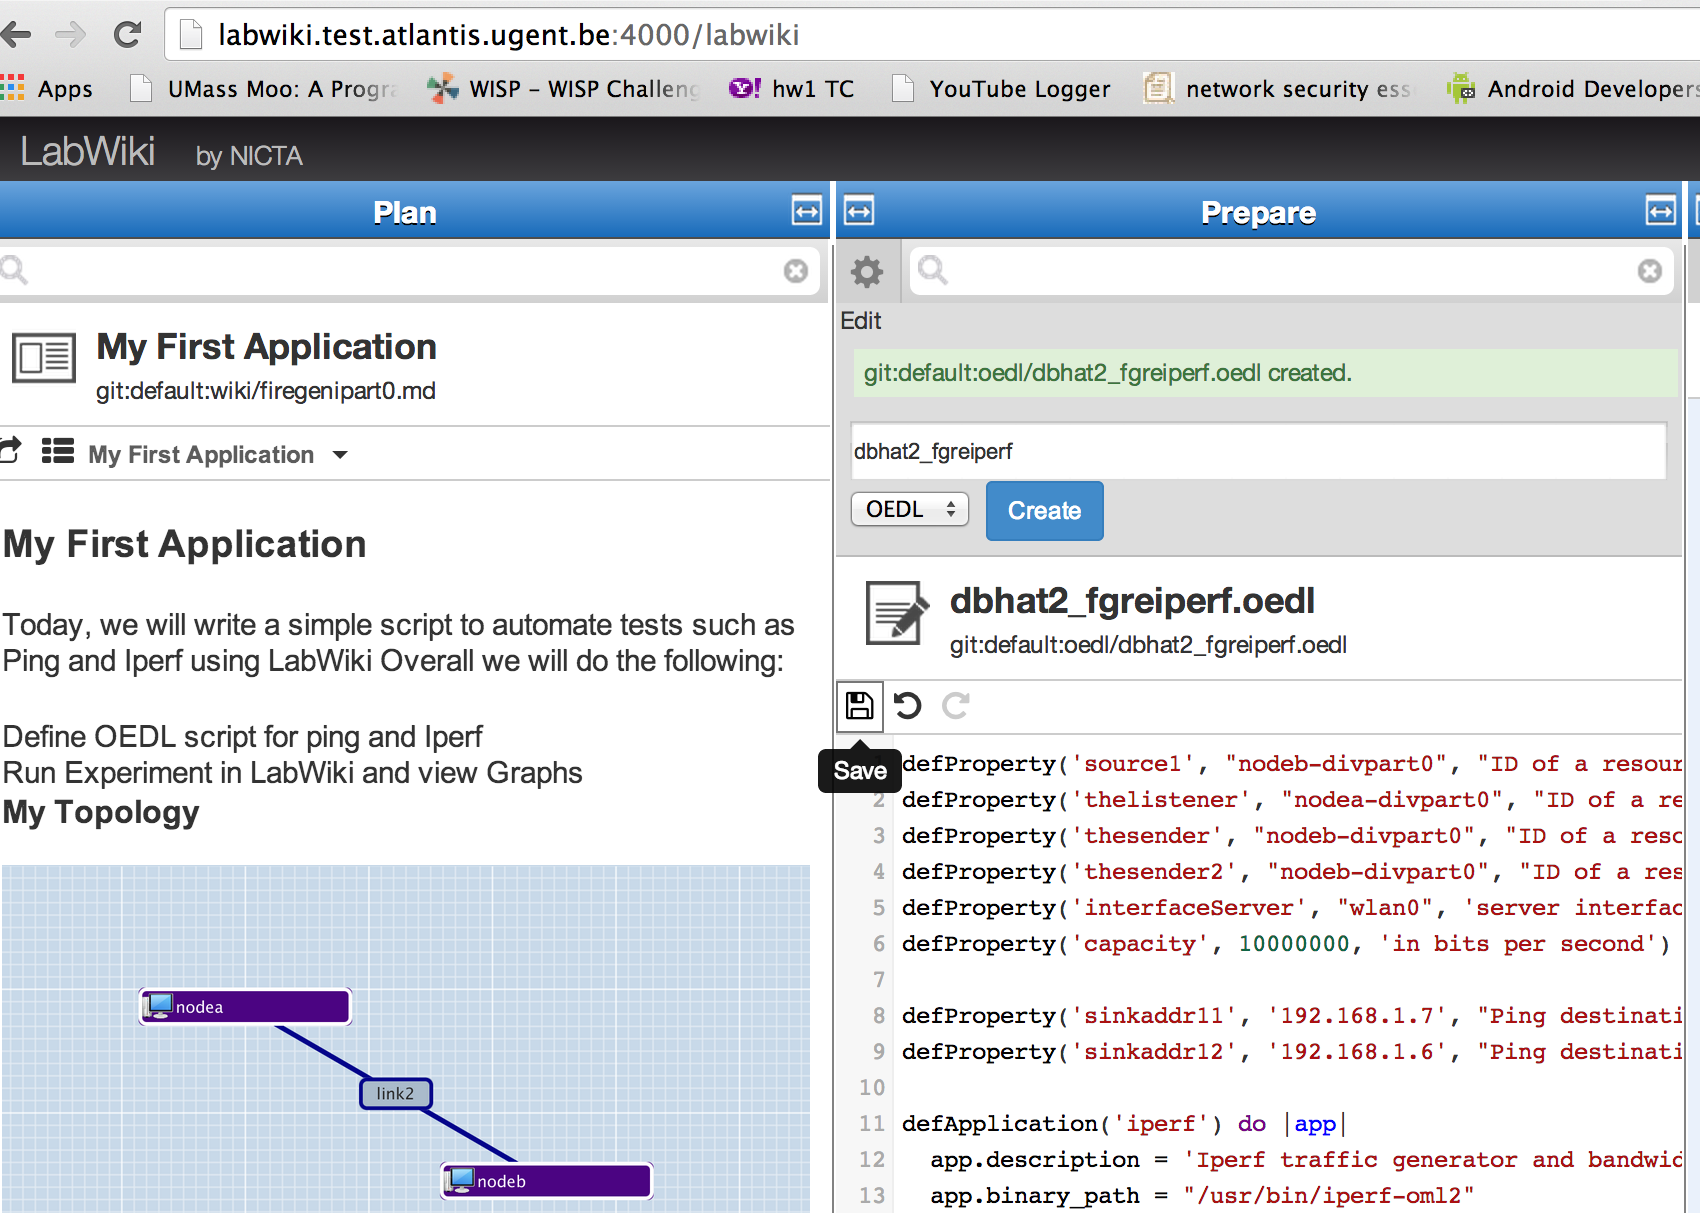
We will now create our OEDL script.
In the Search bar in the prepare window, find the script fgreiperf.oedl and click on it to load it. Copy the contents of the script (Keyboard shortcuts work here).
Note: Create a new script by clicking on the wheel and prepend your username to the name of the script. Paste the contents of fgreiperf.oedl to create a copy of your own.
Please do not modify the original script.

The script is also shown here for your reference:
2.1.3 Start your application from LabWiki
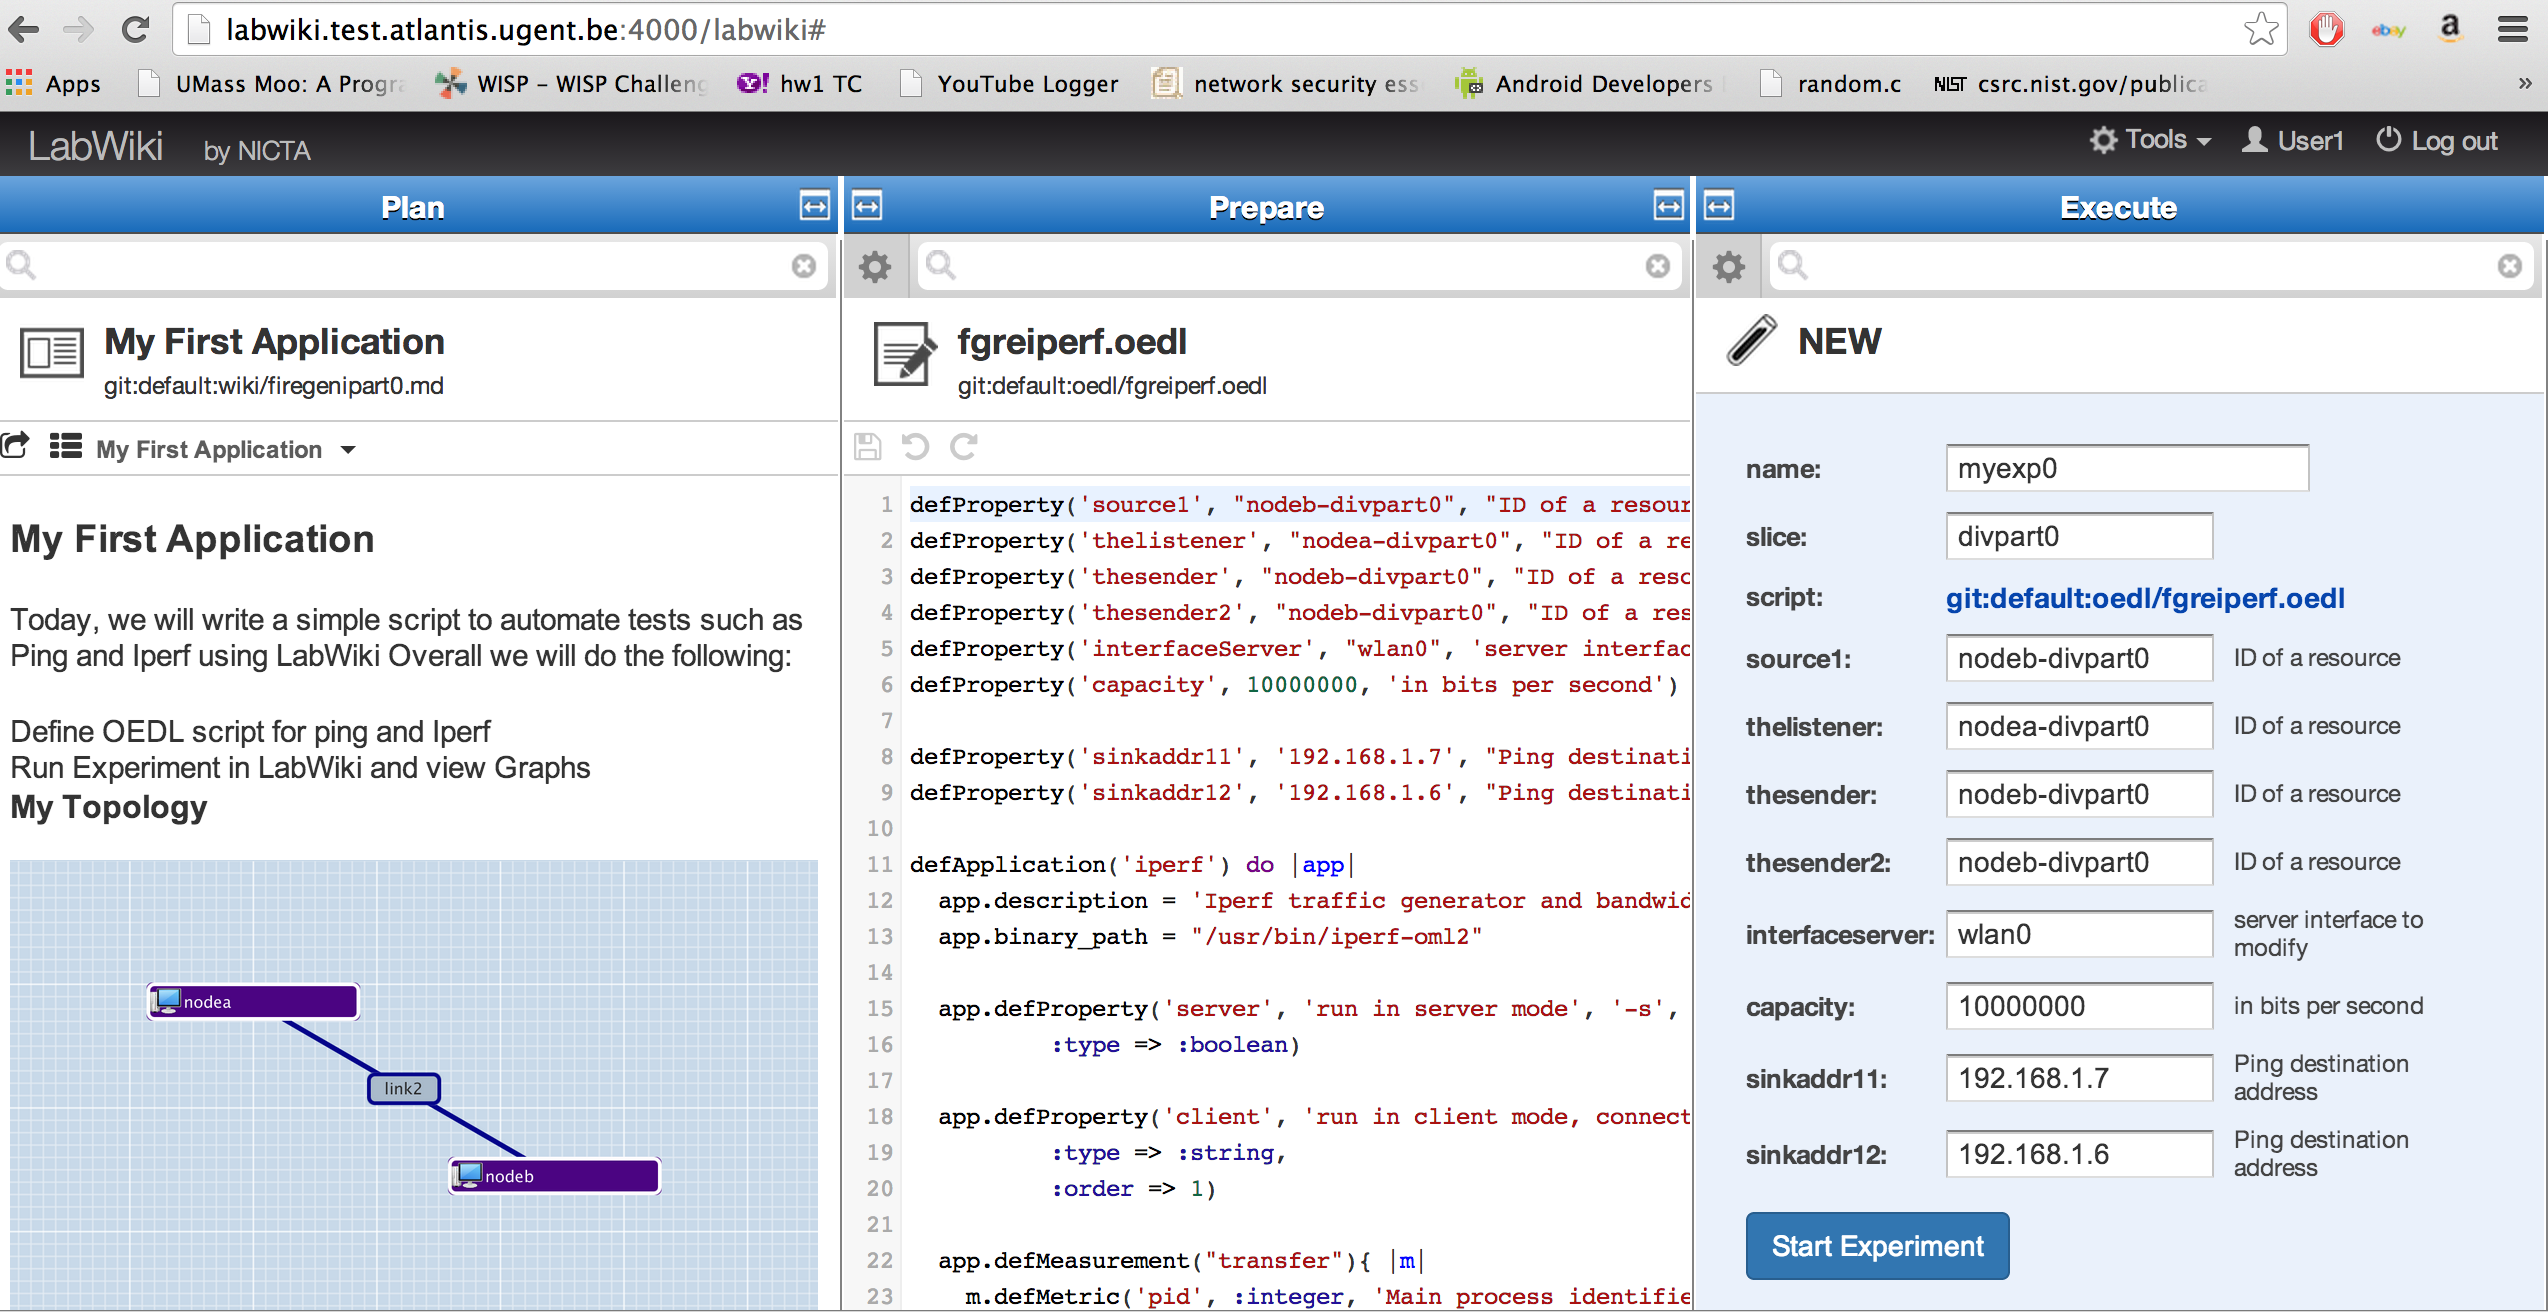
To start your experiment, simply drag the icon that is to the left of the file name (see figure below) from the middle (Prepare) to the right (Execute) window. Explanation of the fields in the Execute window:
- name: In this field you specify the name of your experiment.
- slice: Type the name of the slice you would like to run your experiment on
*Change source1, source2 and source3 fields to include your slice name similar to nodea-<slicename>
Then, start the actual experiment by clicking on the "Start Experiment" button.

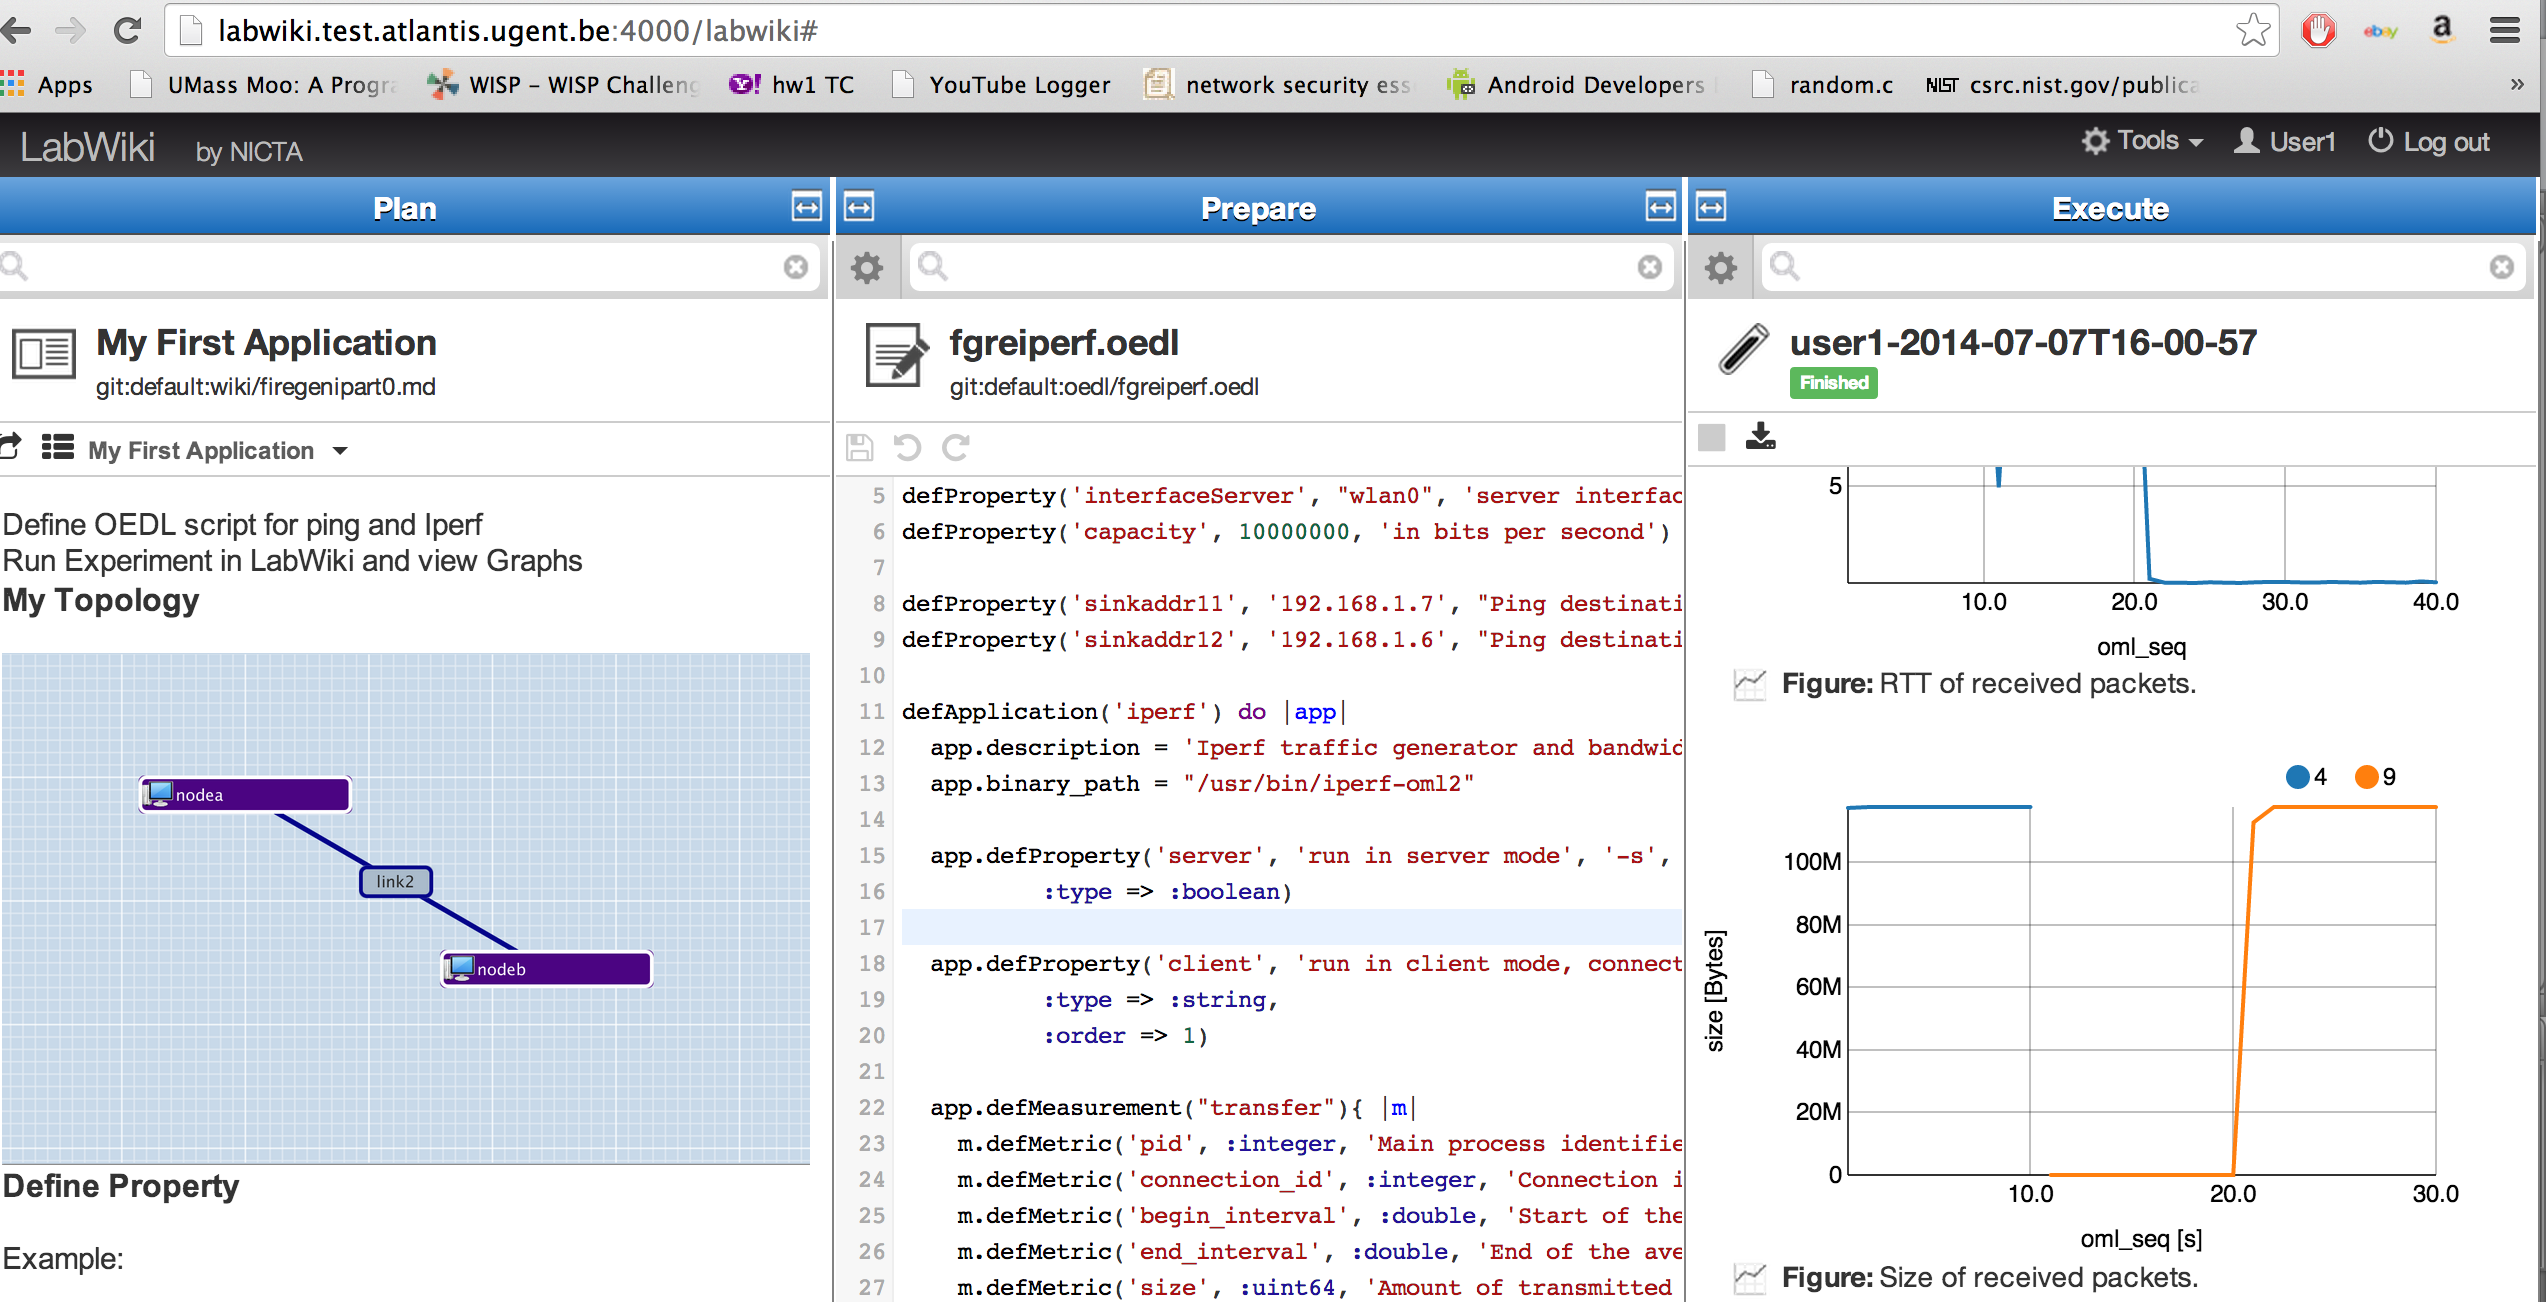
3.1.4 During experiment execution
After pressing the "Start" button, the Execute window will change and start showing status information about your experiment. The figure below gives an example for the Execute window during experiment execution.

Now the window lists experiment properties, one or several live graphs (if they have been specified in the OEDL script), and logging information. The latter would be a good starting point for trouble shooting, should your experiment not run as expected.
Depending on the status of your resources and experiments, you will see one of the following statuses at the top of the Execute window:
- Pending - This is the first state of your experiment where the job scheduler adds it to the run queue. This status would remain for the first few seconds before it changes to Running or Failed
- Running - This status appears when your experiment starts running. If it fails for one or more reasons, a Failed status will appear instead
- Aborted - When you click on "Stop Experiment" at the top-left corner of the Execute window, the status changes to aborted
- Finished - When your experiment is done, you will see this status
Design
Next: Finish
Attachments (6)
- LW_part0a.png (716.6 KB) - added by 10 years ago.
- LW_part0ab.png (669.5 KB) - added by 10 years ago.
- LW_part0abc.png (483.6 KB) - added by 10 years ago.
- LW_prepare2.png (222.0 KB) - added by 10 years ago.
- LW_prepare3.png (132.6 KB) - added by 10 years ago.
- LW_prepare1.png (566.7 KB) - added by 10 years ago.