
Appendix for the Understanding the AM API using Content Centric Networking Exercise
5.2 Visualizing your Content Centric Networking (CCN) application using the GENI Desktop
These are instructions for the optional part of the Understanding the AM API using a Content Centric Networking application tutorial. Make sure you have completed the instructions at Run the CCN application before you continue.
5.2.1 Launch the GENI Desktop
|

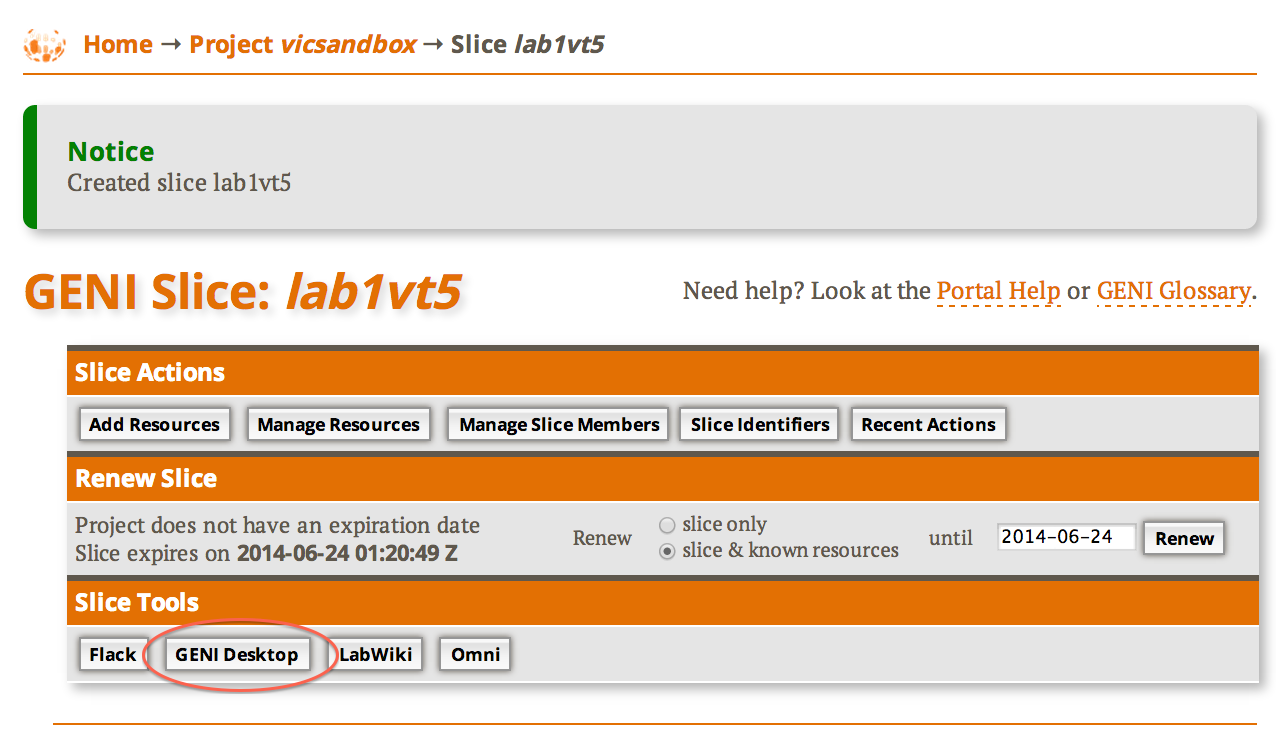
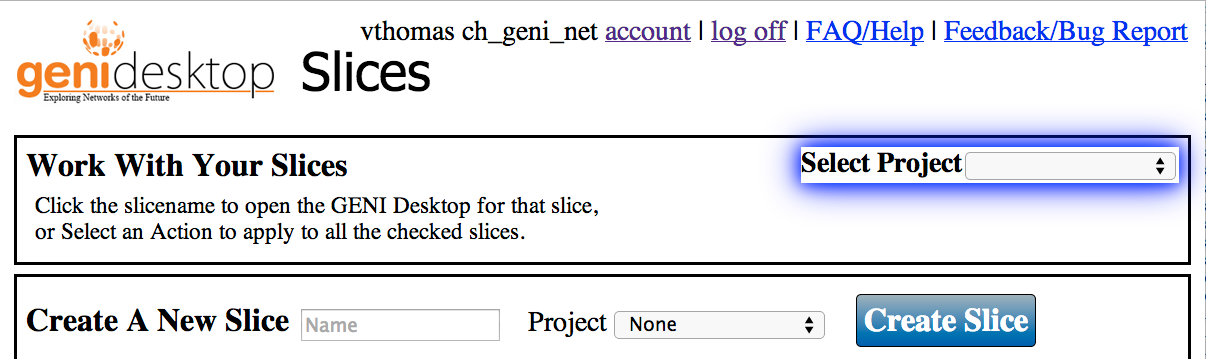
Figure 5-1 Click on the GENI Desktop button in the Slice Tools section of your Slice page. |
|
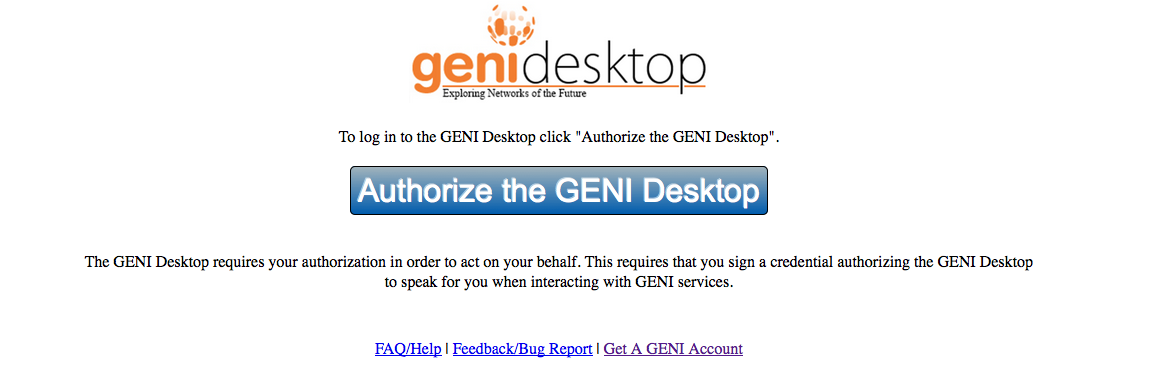
Figure 5-2 Click on the Authorize the GENI Desktop button. |
|
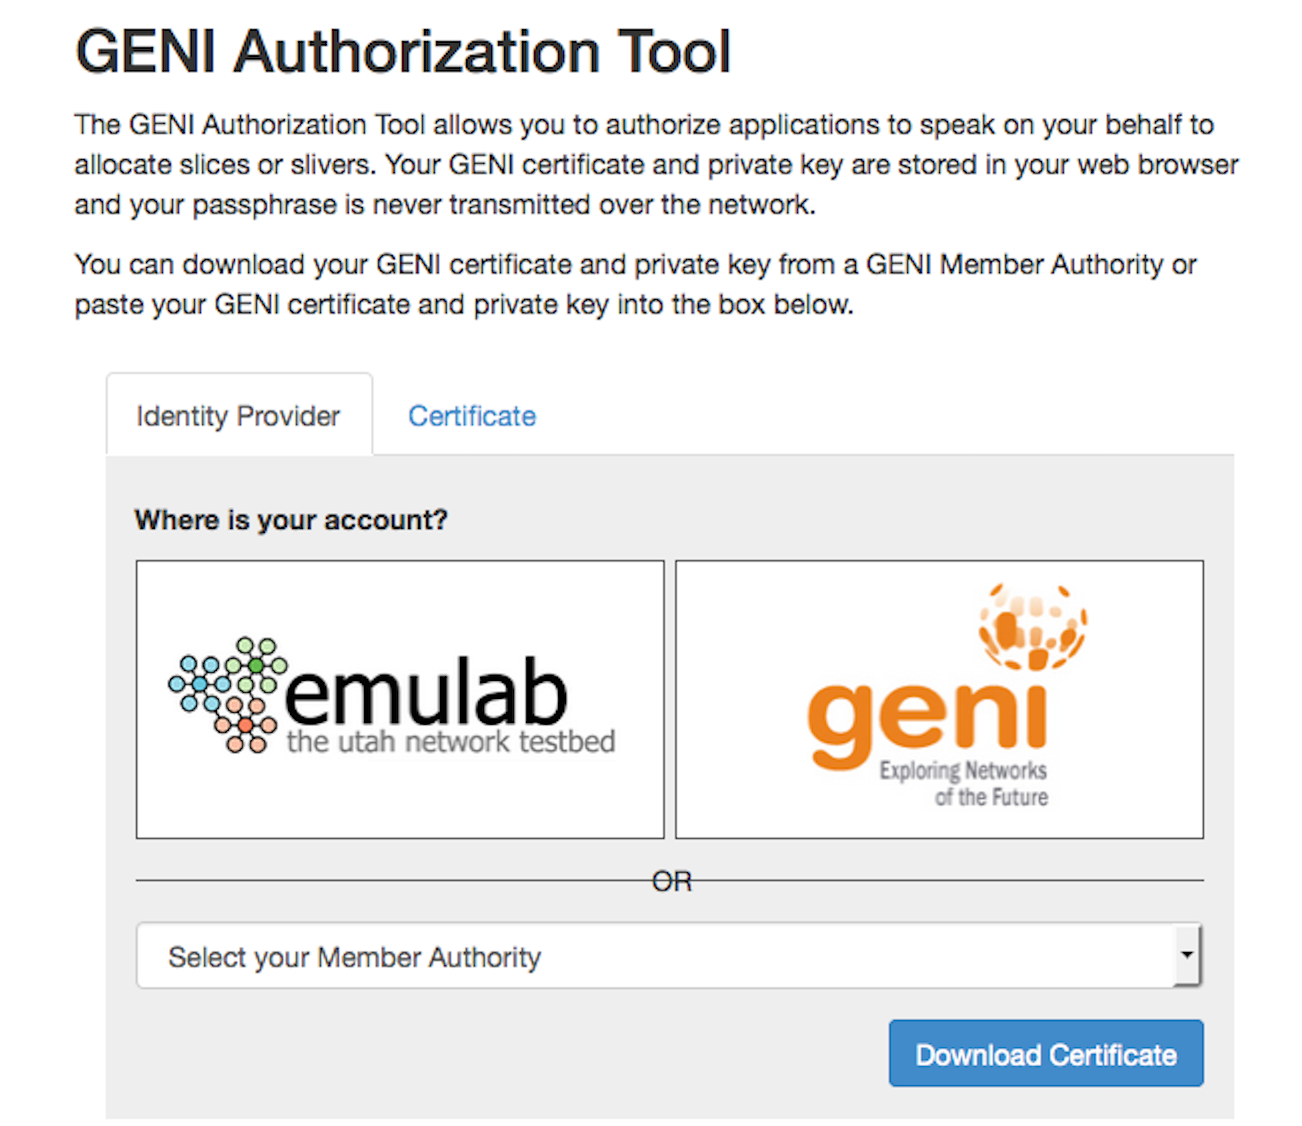
Figure 5-3 Click on your member authority. |
|
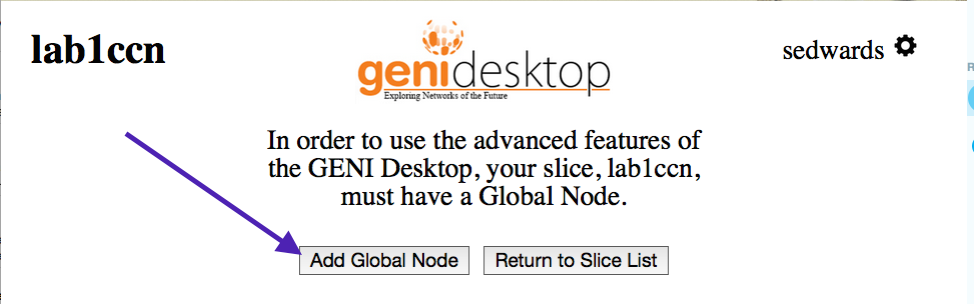
Figure 5-4 Click on Add Global Node. |
|
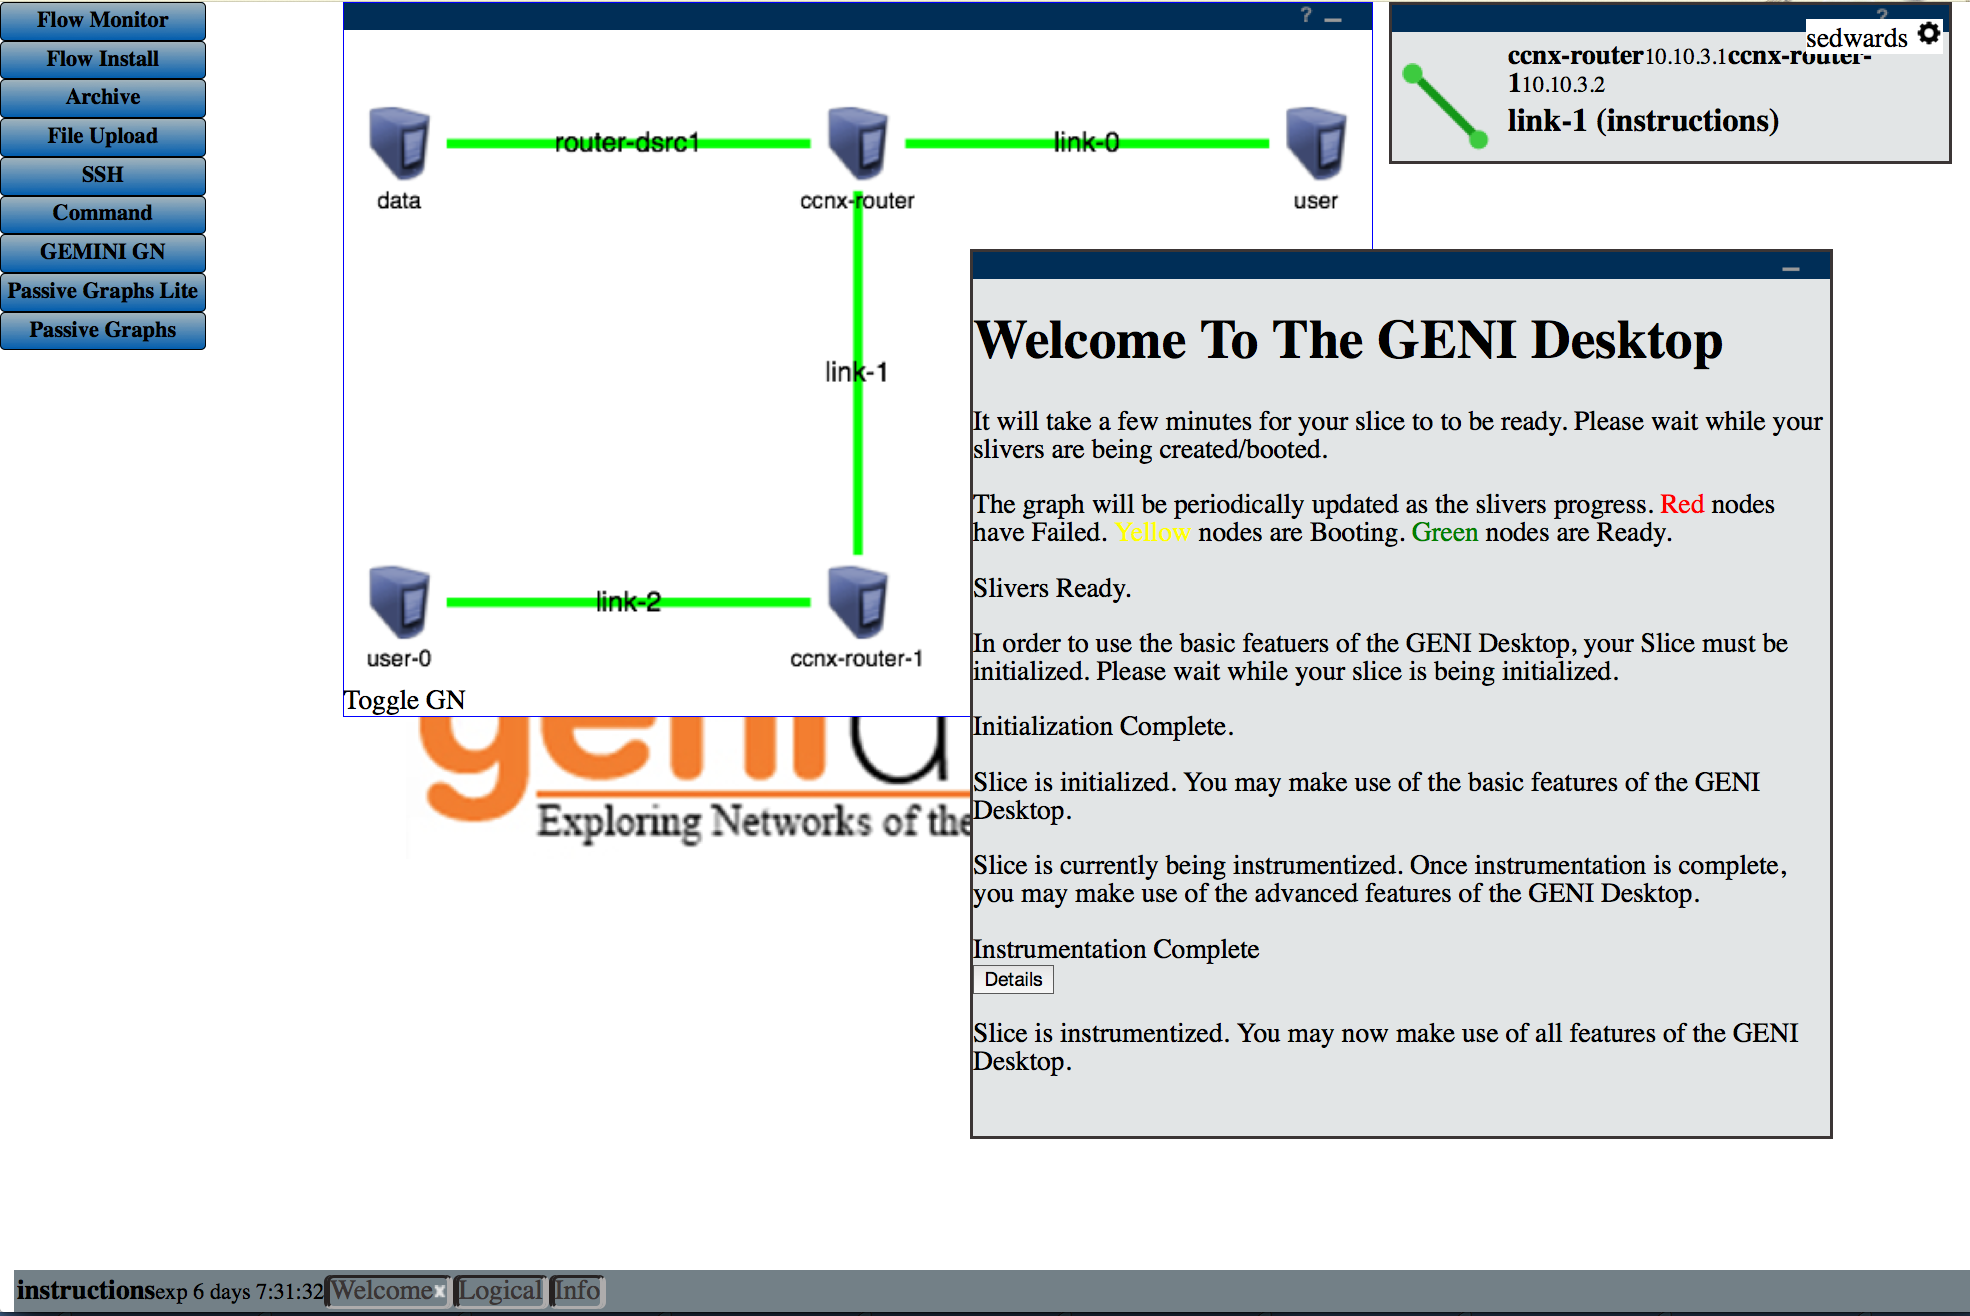
Figure 5-5 GENI Desktop Welcome. |
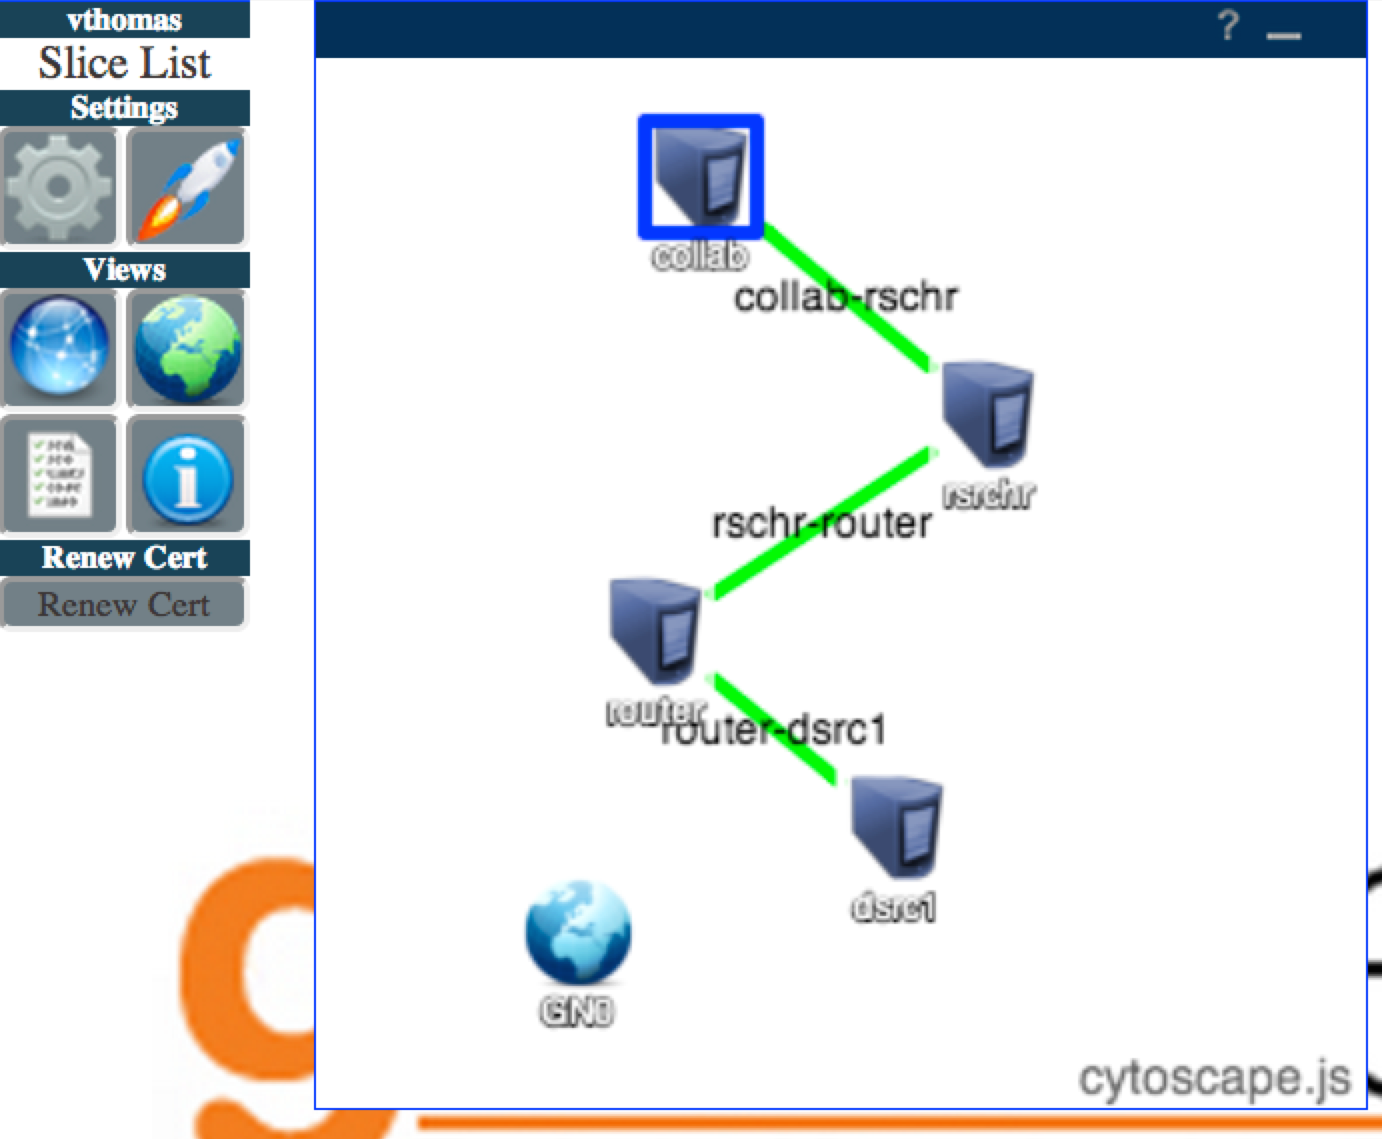
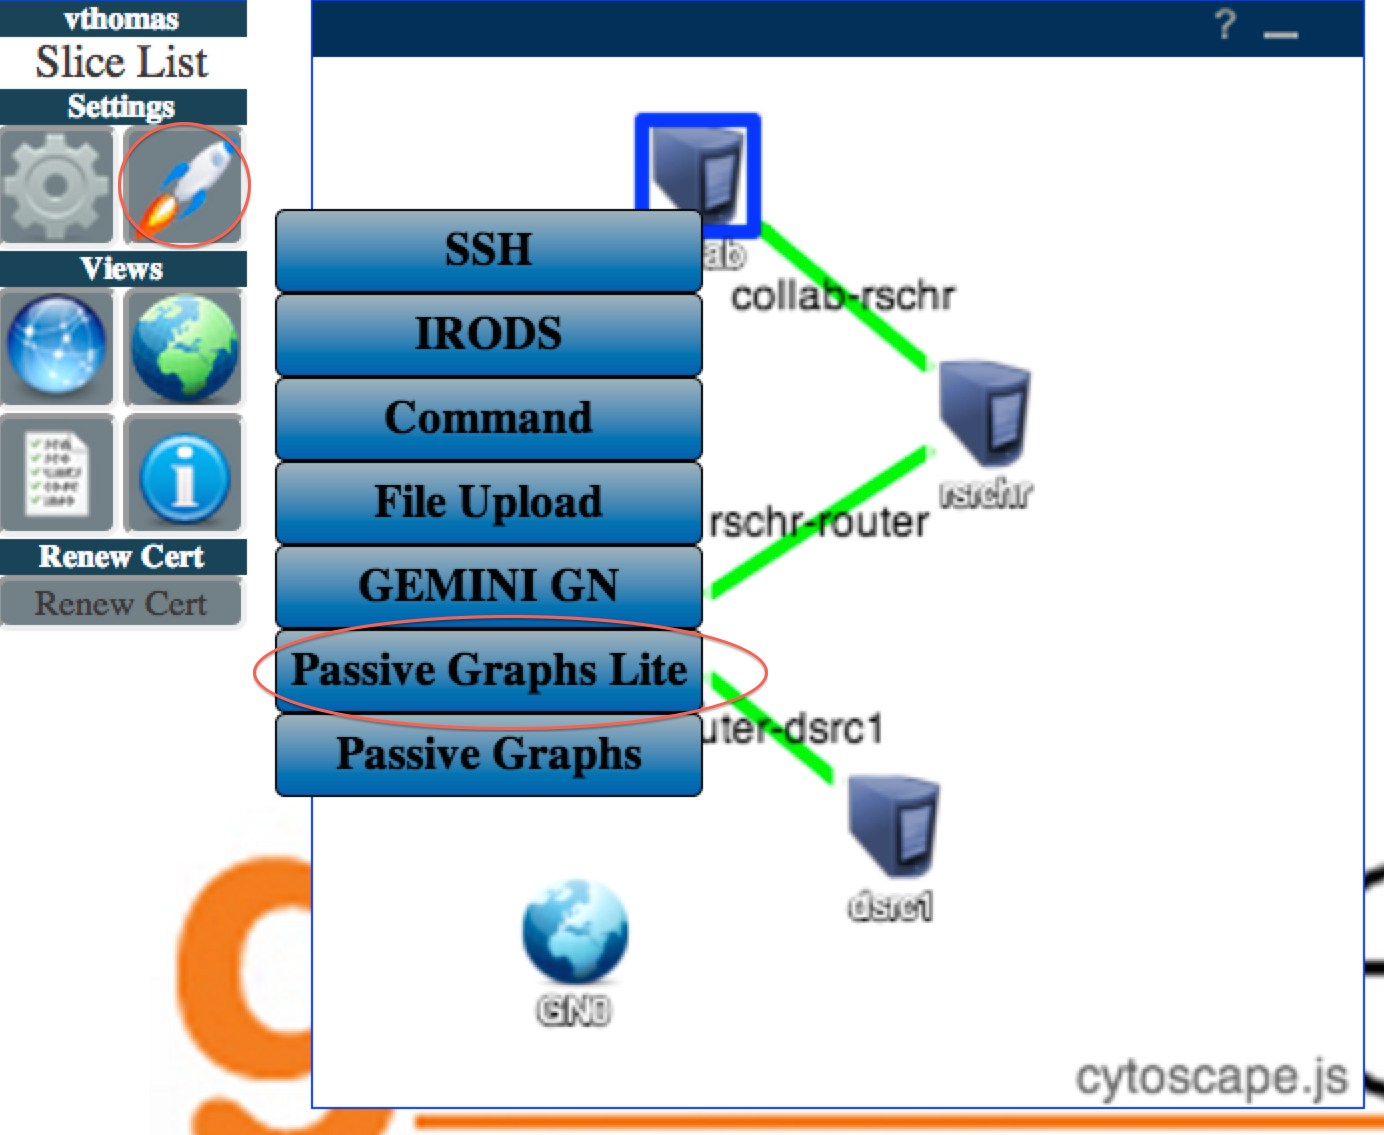
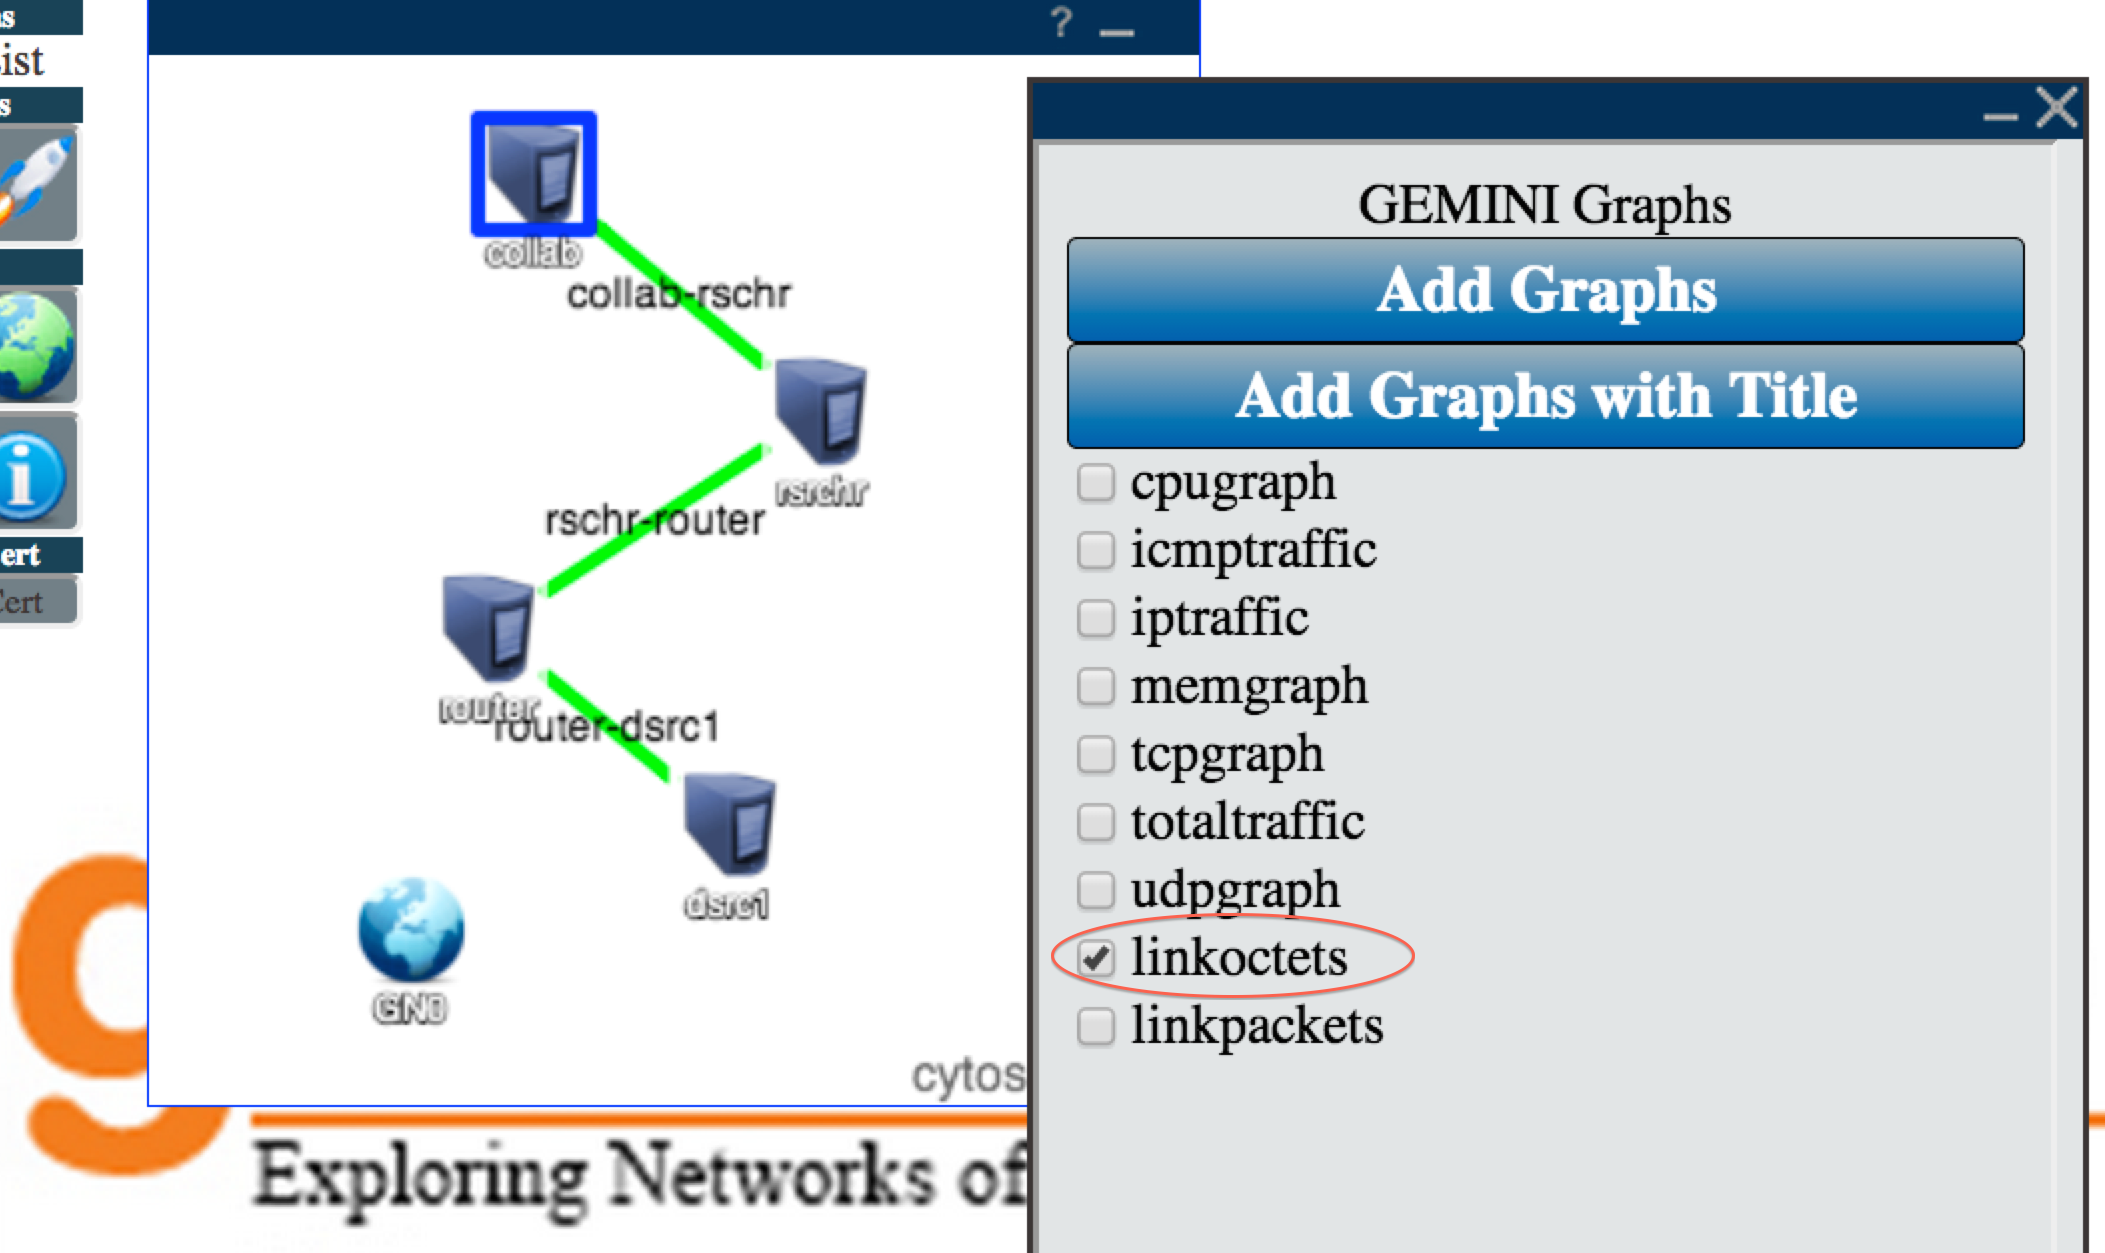
5.2.2 Setting up the visualization
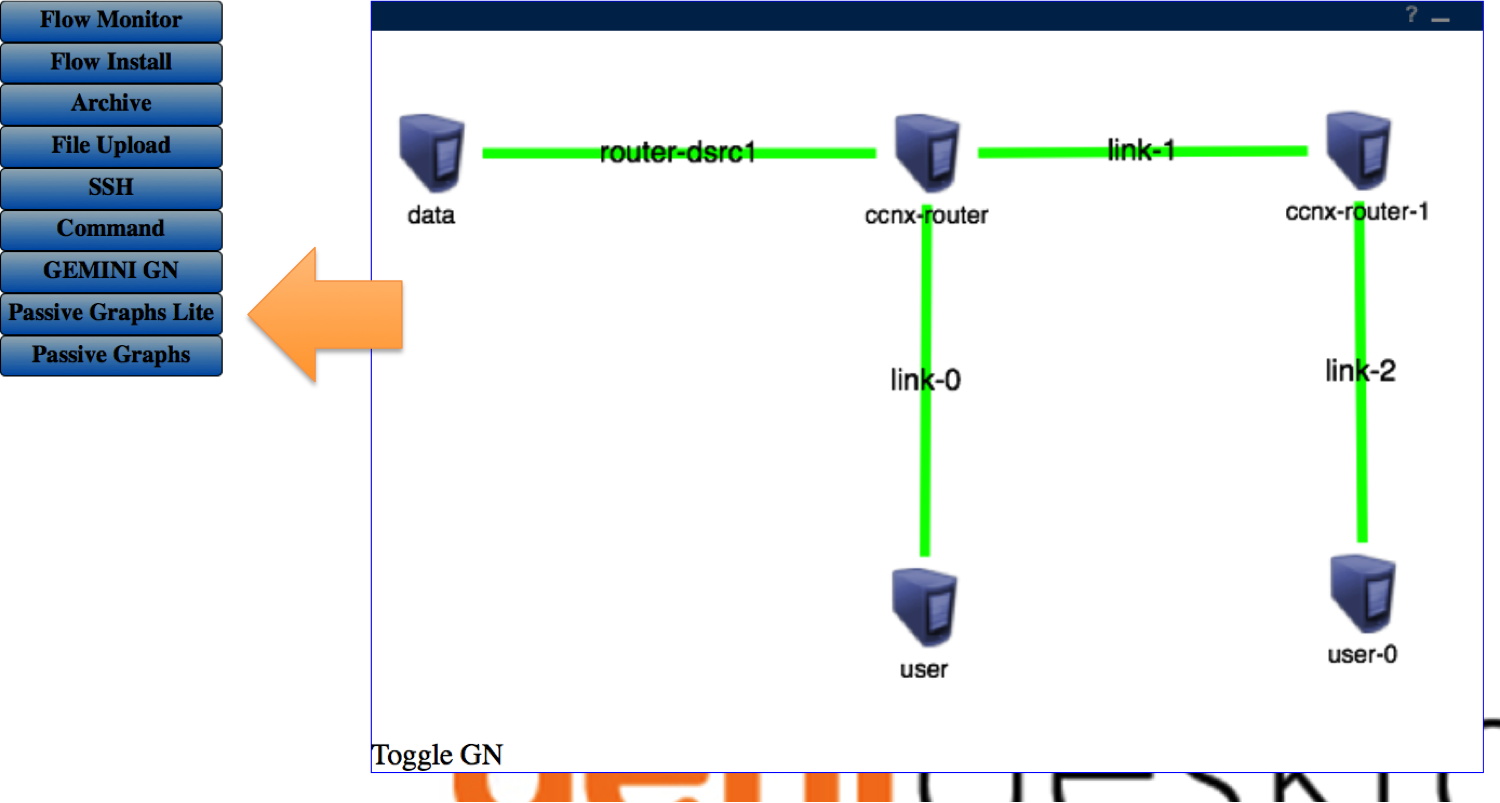
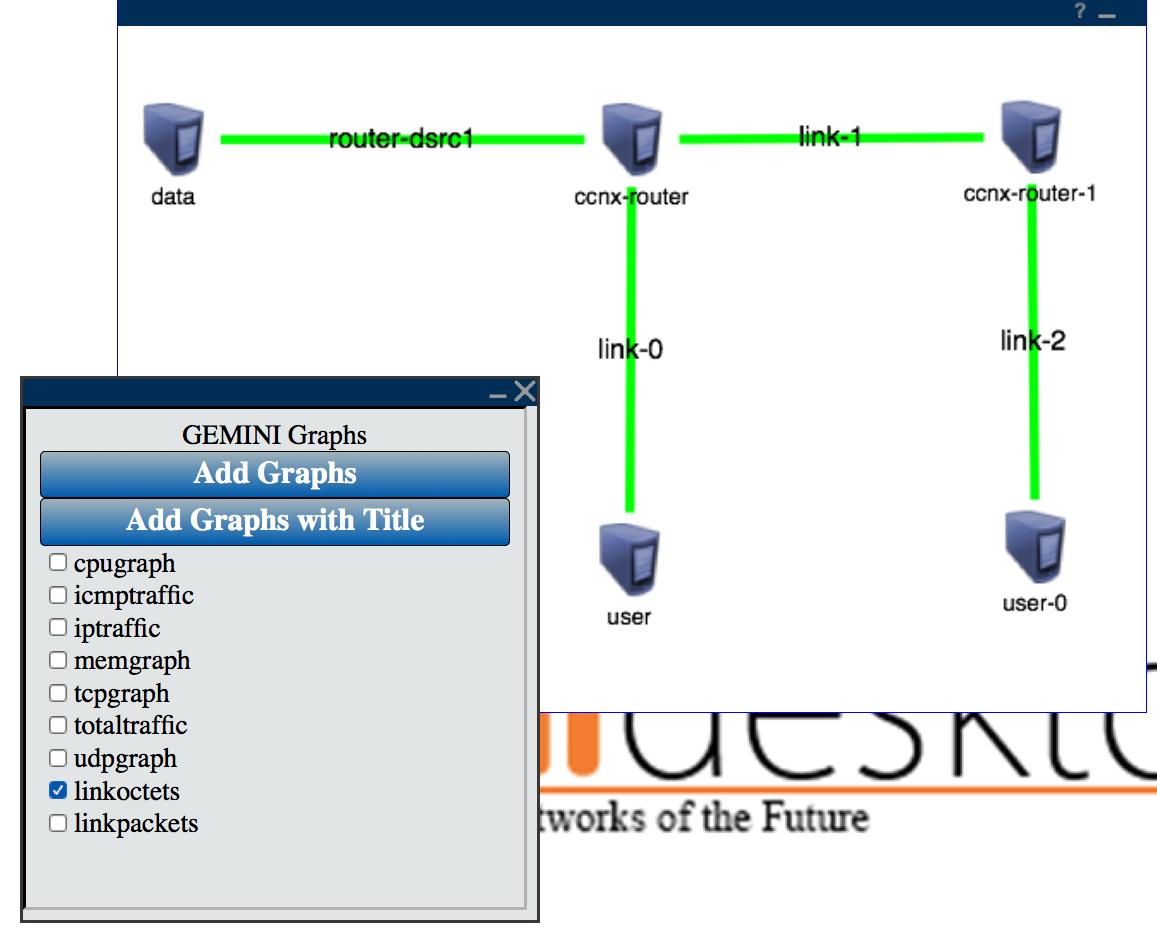
We are now ready to graph traffic on the four links of the topology.
|
|
|
|
|
|
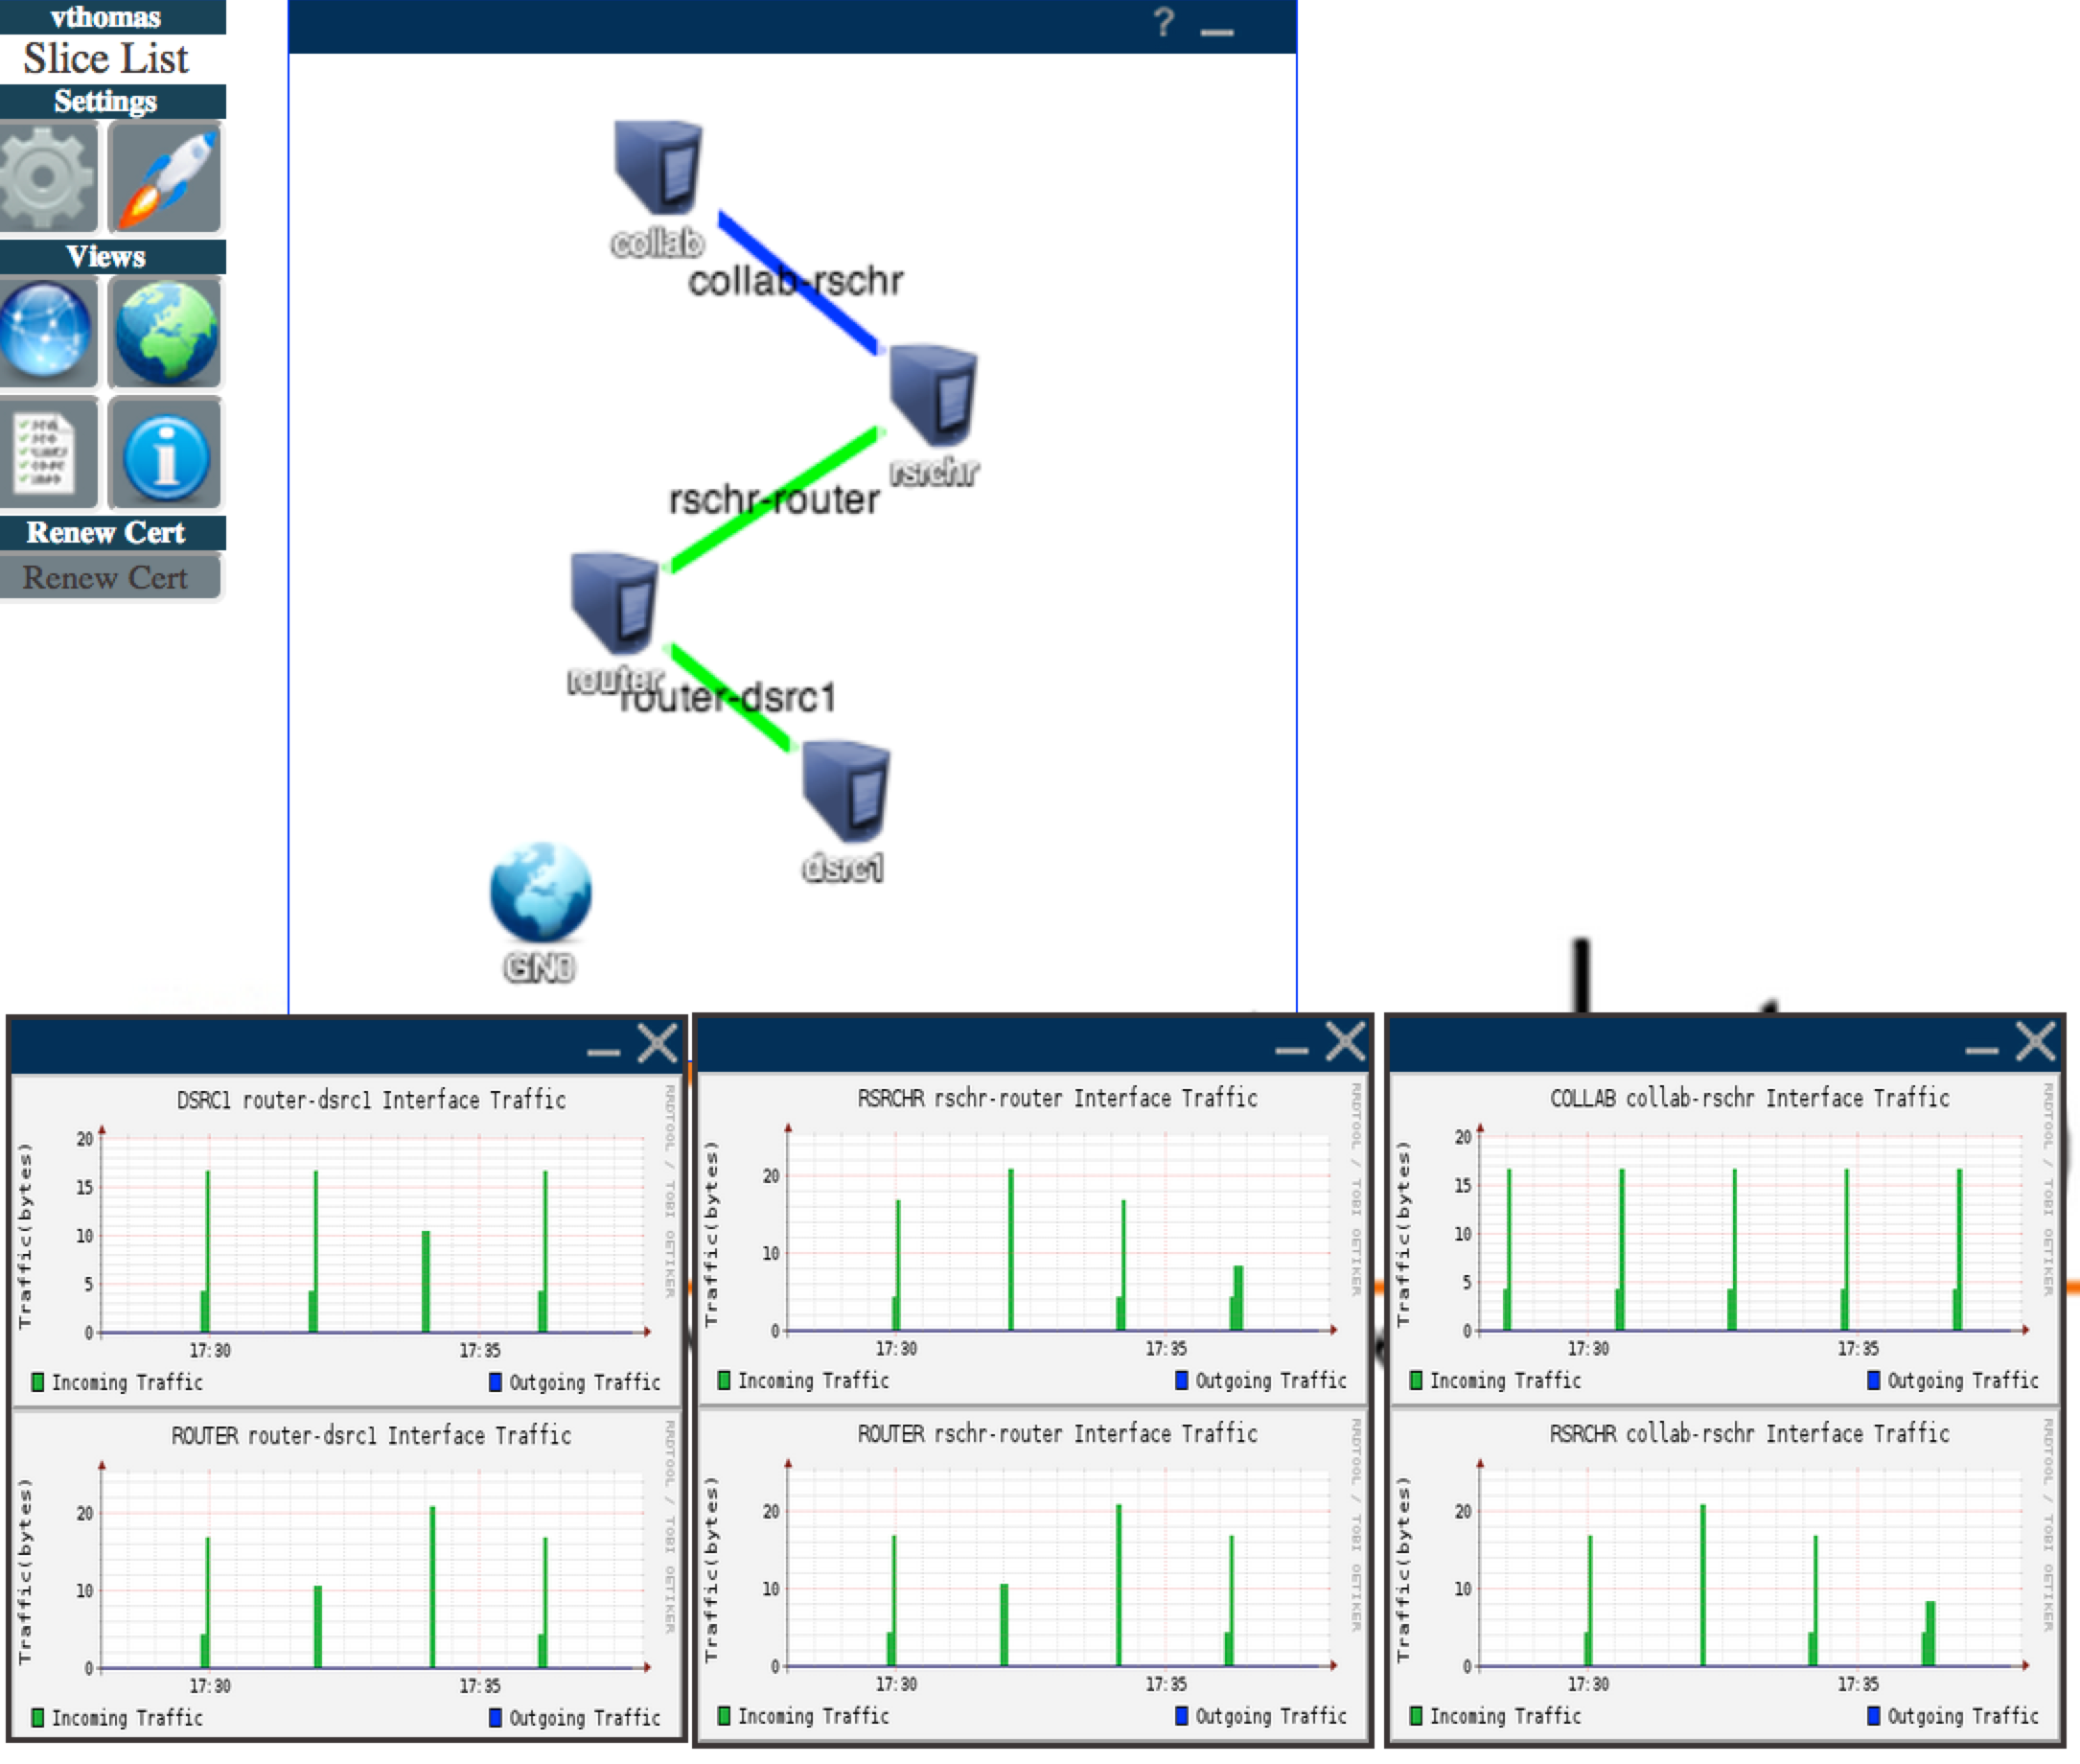
5.2.3 Visualizing your Experiment
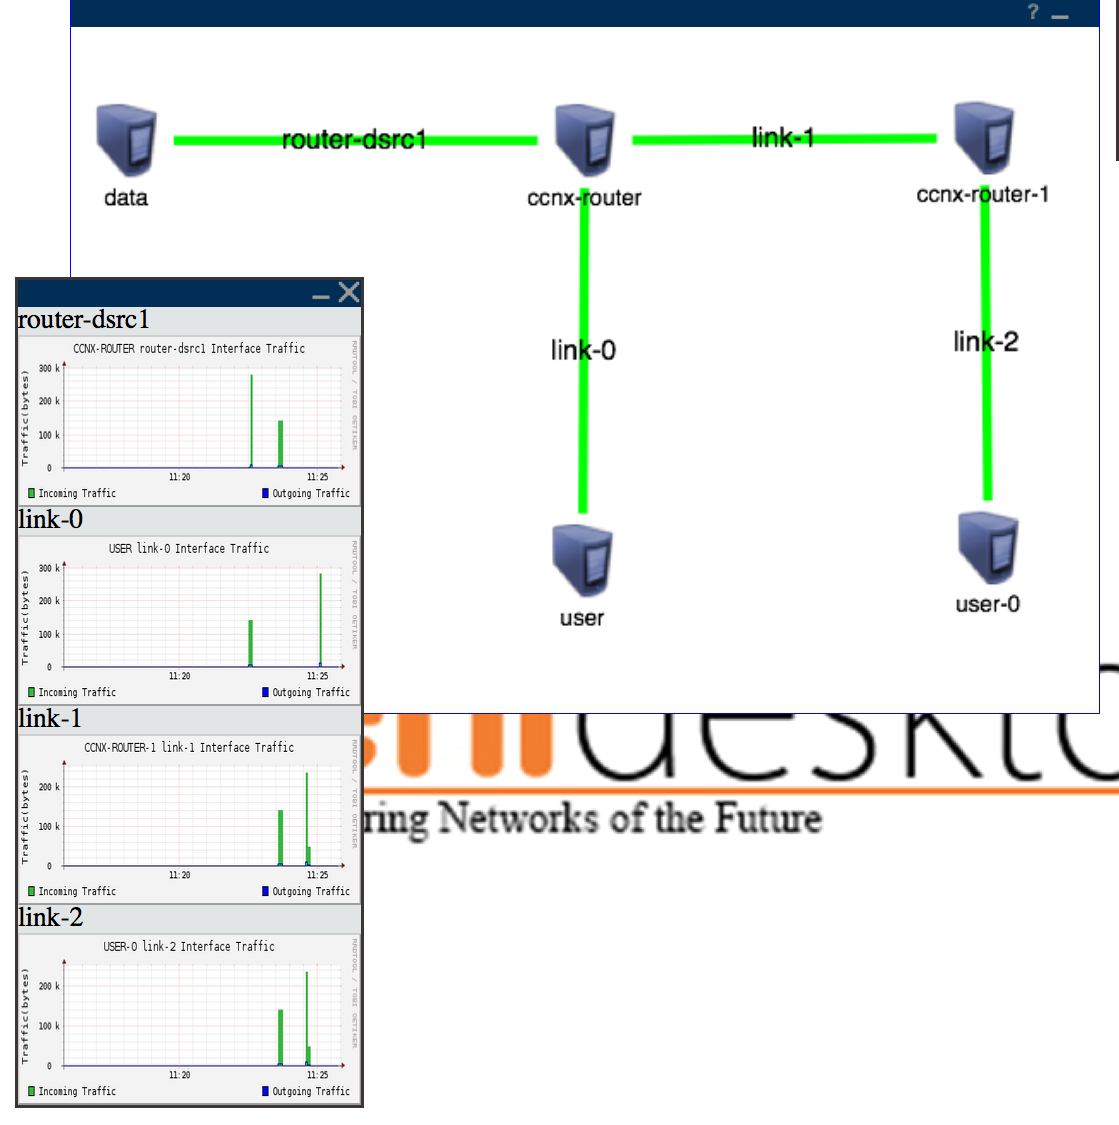
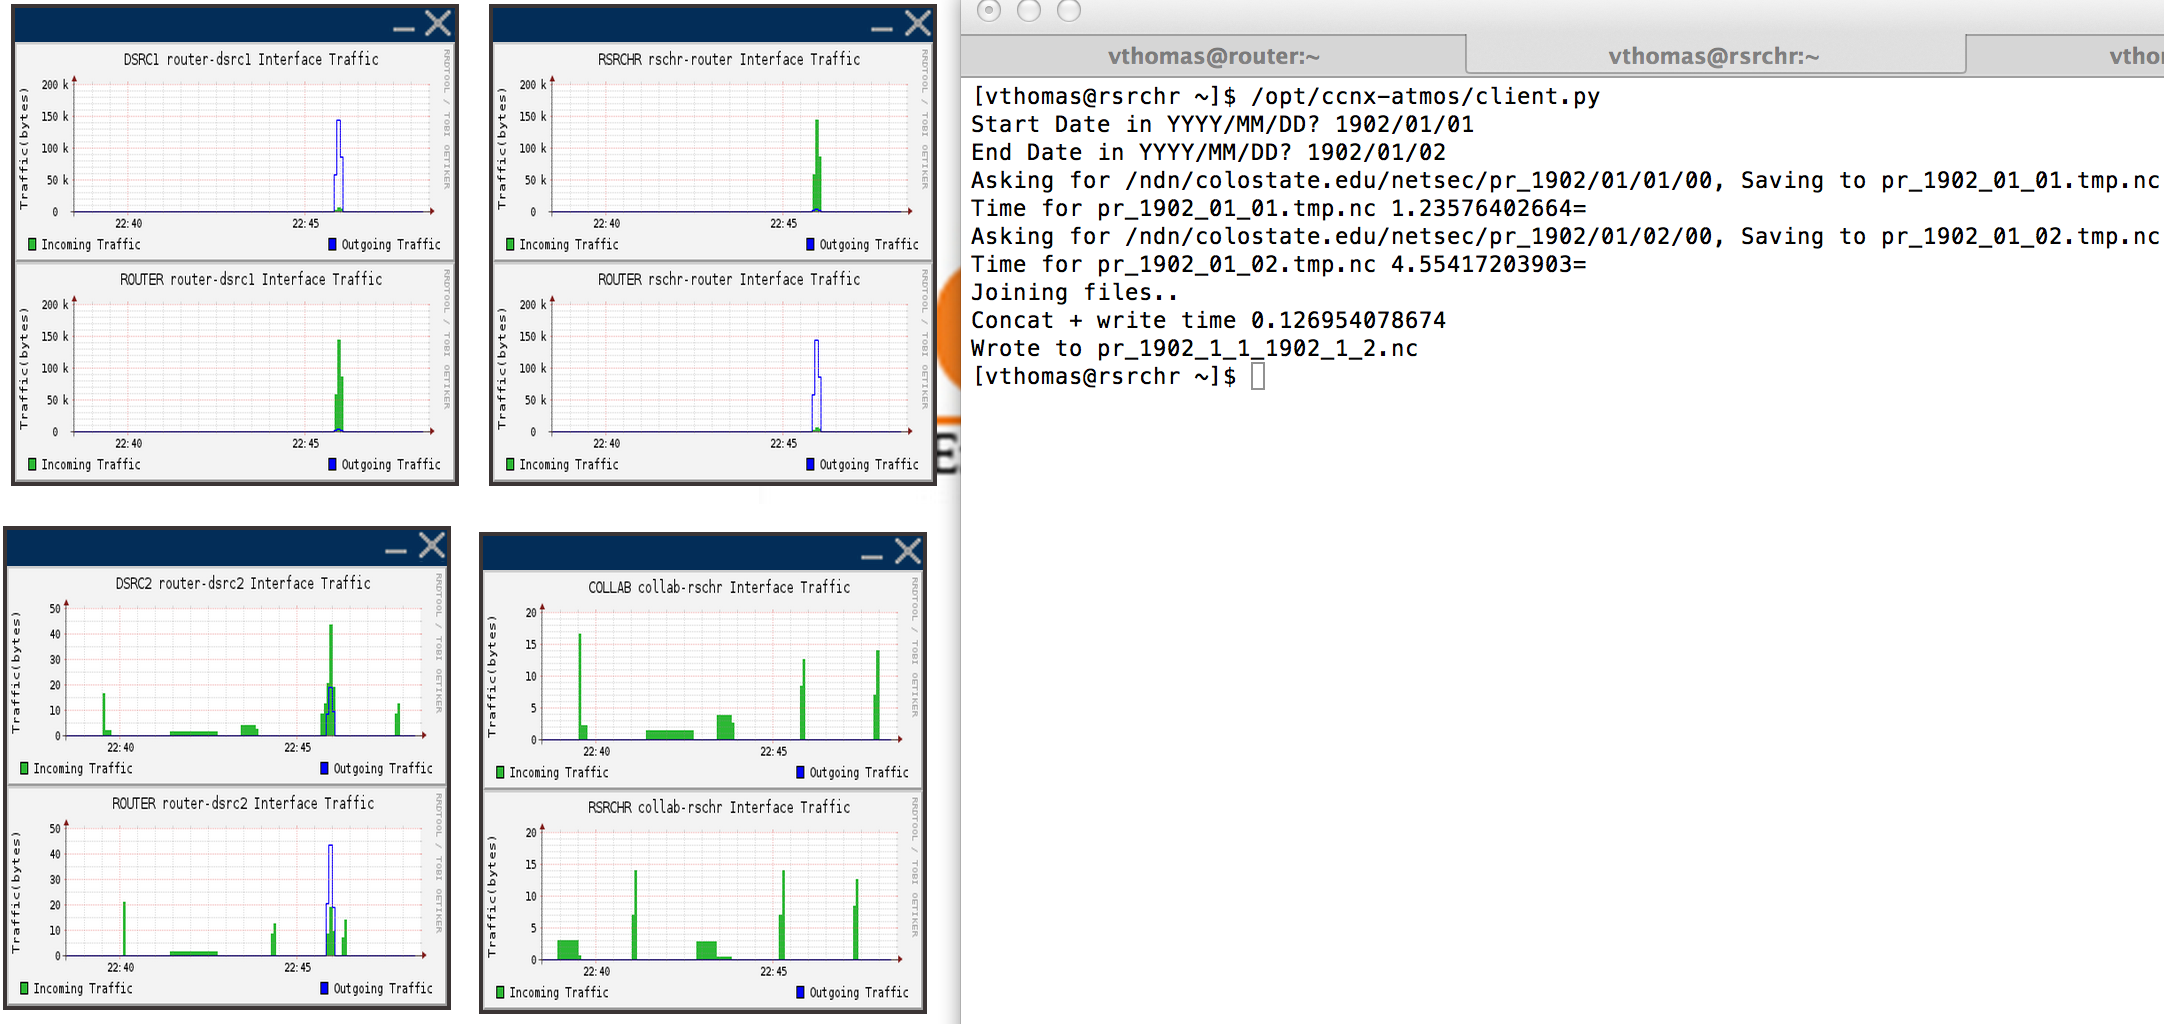
- At this point you will see four graphs showing traffic on each of the four links on your experiment. The traffic you see on the links is broadcast traffic from the switch on the rack to which these nodes connect. It is not related to your experiment.
|
- Your graphs should now show traffic on the
router-dsrc1andlink0links (see example below). The graph on the left is the network being quiet, while the graph on the right shows traffic flowing. This is because the precipitation data was not cached anywhere and had to be fetched from the data source. Please take note that the graphs are not scaled for direct comparison and take careful note of whether the max Y values are in bytes or kilobytes.

- Fetch the same data again. Notice there is no experiment traffic on the links. This is because the data was fetched from the cache on the node
user.
- You can investigate the CCN application further:
- Log into the collaborator node (
user-1) to fetch data that was previously fetched by the researcher node (user). Can you tell from where the data is fetched based on the graphs? - From the collaborator node fetch data that was not previously fetched by the researcher. Where did the data come from this time?
- Log into the collaborator node (
Cleaning up
Go back to the CCN exercise to free up the resources you used in this experiment.
Last modified 8 years ago
Last modified on 06/16/16 17:27:31
Attachments (9)
- GENIDesktopButtonCropped.png (142.6 KB) - added by 10 years ago.
- desktop-selectProject.png (103.6 KB) - added by 10 years ago.
- desktop-otherSlices.png (145.6 KB) - added by 10 years ago.
- desktop-dispCheckedSlicesCropped.png (156.7 KB) - added by 10 years ago.
- pull-researcherCropped.png (646.7 KB) - added by 10 years ago.
- desktop-mainCropped.png (420.8 KB) - added by 10 years ago.
- desktop-launcherCropped.png (518.2 KB) - added by 10 years ago.
- desktop-addGraphsCropped.png (607.5 KB) - added by 10 years ago.
- desktop-allGraphsCropped.png (846.5 KB) - added by 10 years ago.