| Version 5 (modified by , 12 years ago) (diff) |
|---|
GEMINI/Tutorial/GEC15/ActiveMeasurements
Configuring Active Measurements
The GEMINI I&M system in its current version facilitates regular measurements of throughput, one-way delay and round-trip delay. Other metrics like jitter and loss can also be derived from these measurements.
The GEMINI services on a given node are configured by the pSConfig service. This service reads configuration stored in UNIS as part of the node's topology information and applies it to local configuration files. pSConfig will also start enabled services or stop disabled services that are running.
We will now configure one-way (OWAMP) and round-trip (Ping) latency regular tests between VM1 and VM4.
Accessing pSConfig UI
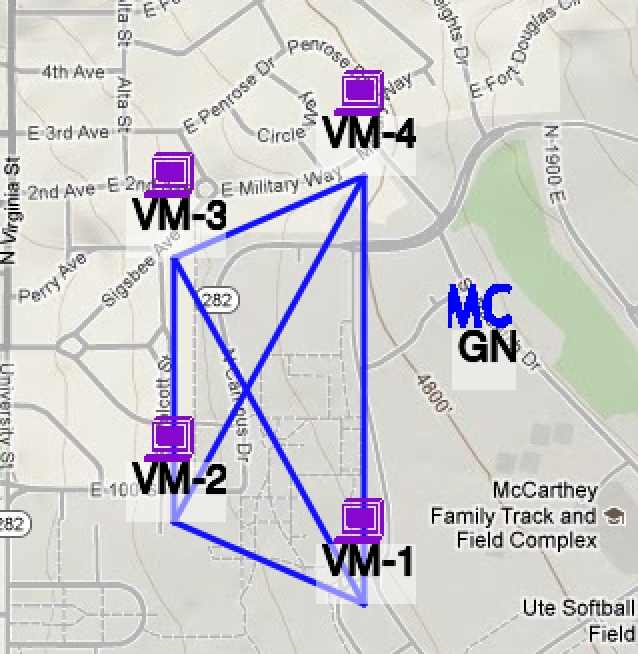
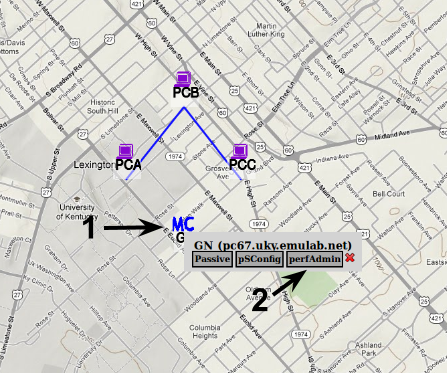
To configure active measurements we access the pSConfig Web UI. You can find the URL by clicking on the MC node on the GEMINI portal, or by going to https://<gn node>/psconfig.
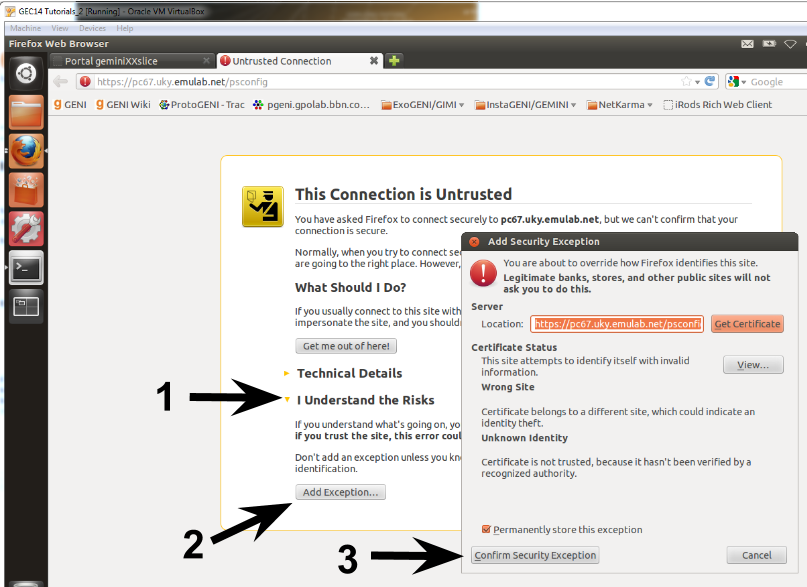
The certificate used by the web server is self-signed, so you will have to add an exception on the browser to proceed.
After adding the exception you should see another pop-up for a certificate request. This time you're providing your user certificate to the service. Make sure the user that is shown for the certificate is the one assigned to you for the tutorial. In this example I'm using the user gemini20. In case you did not see this pop-up or cannot see your user, please redo the steps on User Workspace - Accessing the portal?.
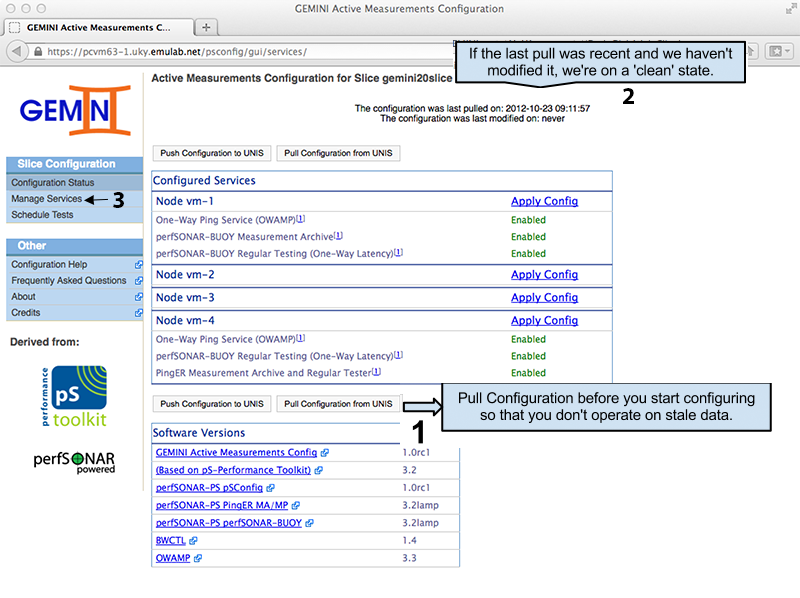
The main page of the pSConfig UI shows what services are currently enabled for each node. It also shows the last time we have synchronized with UNIS (remember that configuration information resides in UNIS). There are other agents that could be changing the information on UNIS, and the pSConfig UI will make sure we don't overwrite changes made since the last pull (i.e. a race condition). It is always a good idea to first pull the current configuration from UNIS before making changes.
Enabling Services
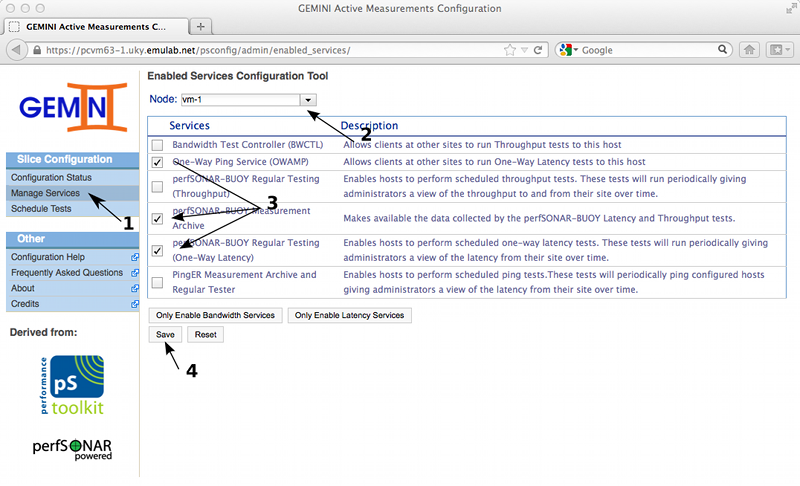
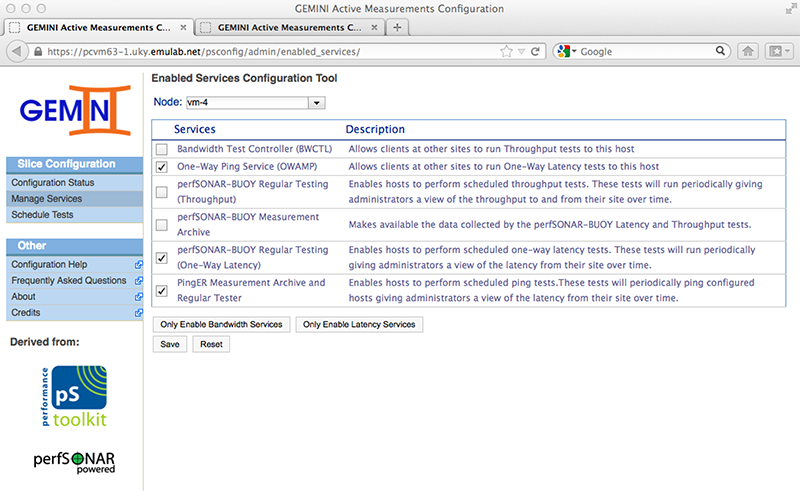
After we've made sure to have a recent copy of the topology information, we can move on to the Manage Services administration page. On this page we will enable the services required to perform on-demand and regularly scheduled tests. We start by enabling the one-way latency services on VM1. Make sure to save the changes before continuing to the next node.
We then proceed to configure the services on node VM4. Since VM4 will receive OWMP probes, we will only enable the daemons for the tools used (owamp). Note that PingER is only enabled on VM4, and we will configure our Ping measurement on that node.
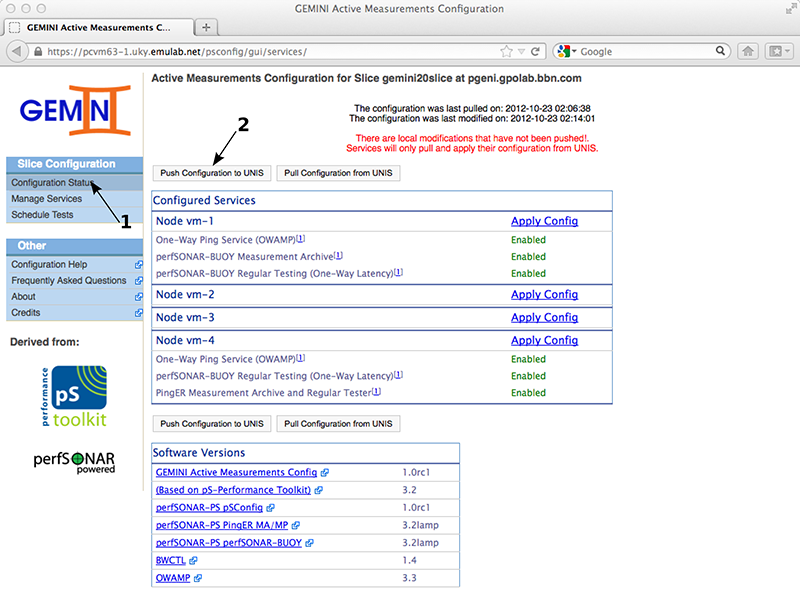
Now that we've enabled the services for our active measurements we will push the configuration to UNIS. To do this we need to go back to the Configuration Status page and then click the Push Configuration to UNIS. You can verify the list of services enabled for each node (i.e. the list in the image should match what you see).
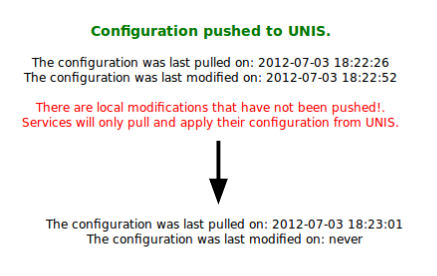
If everything goes well we should see a green message "Configuration pushed to UNIS.". However, the page auto reloads after this, so you might miss it if not paying attention. If there is no error message, the push completed successfully and the modification time will be 'never'.
Success:
Failure (unfortunately, you will have to redo the steps above in the case of a race condition):
Configuring Regular Active Measurements
Enabling the OWAMP and BWCTL daemons is all we need to perform on-demand active measurements. However, it's usually better to have active measurements running regularly to analyze the performance over time. Throughput and ping tests can be scheduled with a given interval (e.g. every 30 minutes). One-way delay tests are scheduled as a stream (a constant amount of packets is sent per second).
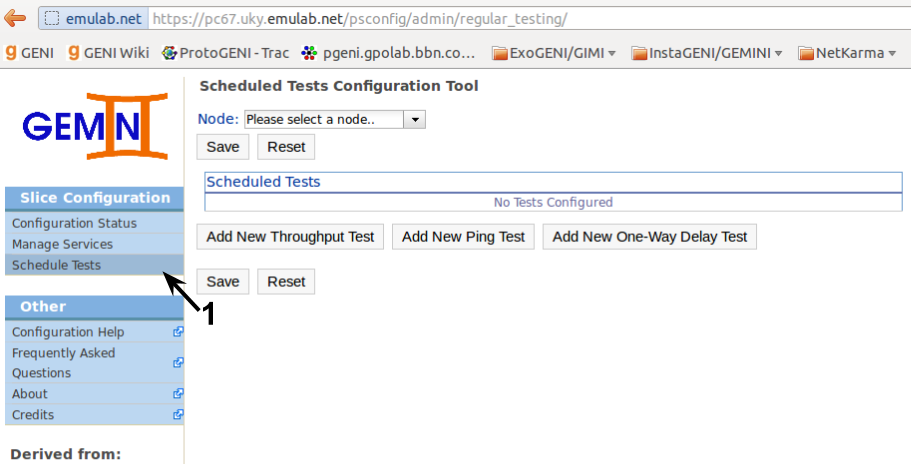
To schedule regular tests we go to the Schedule Tests administration page.
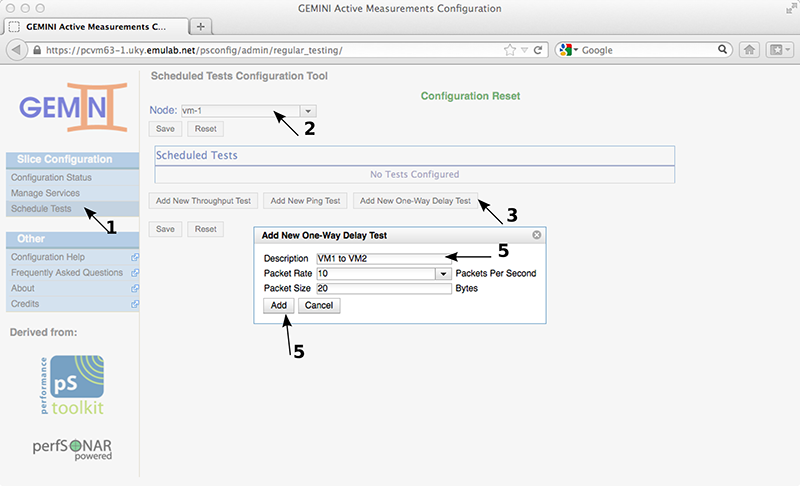
We will schedule OWAMP tests from VM1 to VM4. We could schedule them on either endpoint, as long as both of them are running the appropriate pSBOUY Regular Testing service. In this case we schedule the tests on VM1 by selecting it and adding a new OWAMP test. Clicking the Add New One-Way Delay Test button will pop-up the options to configure the test. The description for the test is only important to you, the services don't use it directly. You can change the packet rate and the packet size used for the test, but we will use the default for the tutorial.
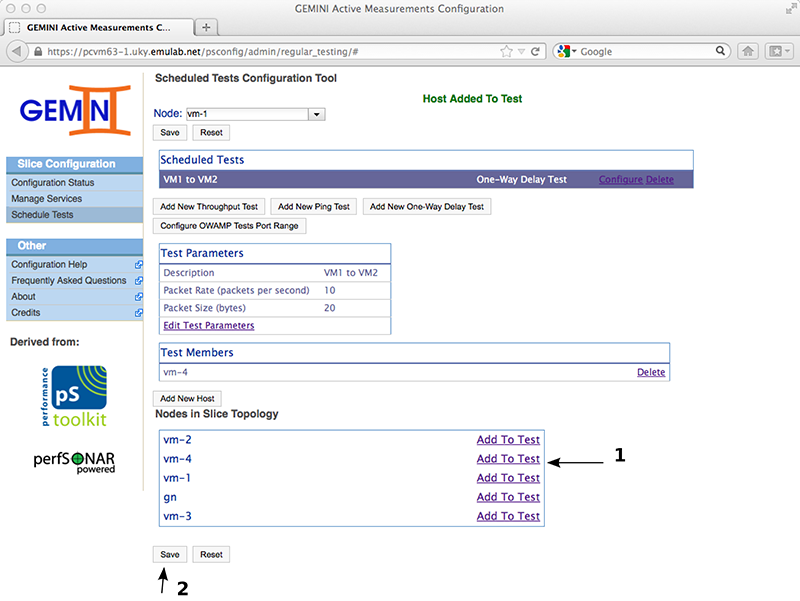
The test we've added establishes the test parameters for a given "star" mesh configuration. We can add multiple targets for this mesh (for OWAMP tests will run in parallel, for BWCTL measurements will be serialized). In this case we add VM4 as a target and save the test.
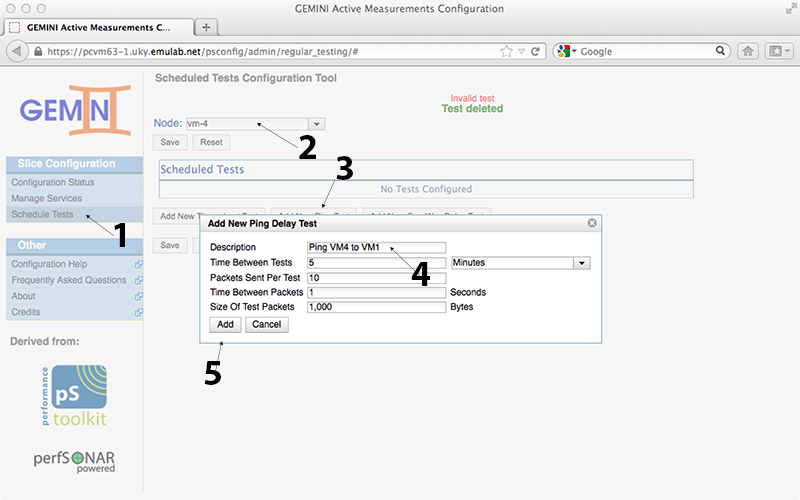
We also add a Ping test between nodes VM4 and VM1, scheduled at node VM4 (this is where we enabled the PingER service).
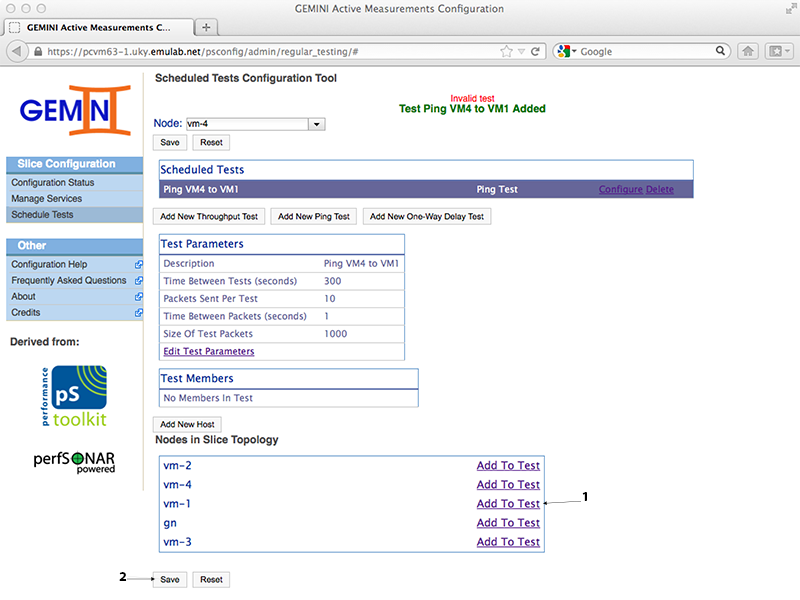
We can configure the standard ping parameters and the description for our test. The default has a relatively large packet size, so keep this in mind when analyzing the latency results (the ideal is to have packets the size of your experiment's packets). After creating the test we need to add our targets (VM1) and save the test. NOTE: You could use the 'Add New Host' button to add hosts outside of the slice (e.g. to ping geni.net).
After adding all these tests we go back to the Configuration Status page and push the configuration to UNIS.
Applying the Configuration
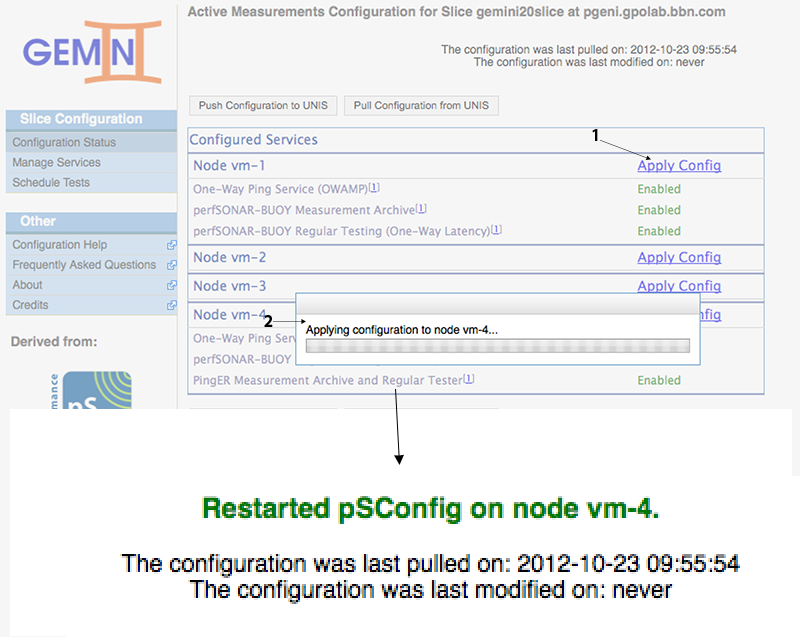
pSConfig will pull the node's configuration from UNIS every 30 minutes (from the time it was started, not hh:00 and hh:30). Since we don't want to wait this long to start gathering data, we can restart pSConfig on each node by clicking the Apply Config link. This is achieved by ssh'ing to the node and restarting pSConfig, so errors are usually ssh related.
Make sure you apply the configuration on all three nodes. We will now run the user experiment to generate some heavier traffic on the slice before looking at the data.
Visualize Measurement Data
Doing the user experiment should have given the scheduled active measurements enough time to gather some data. We also generated some heavy traffic during our iperf data transfers. This section of the tutorial covers how to visualize the data for regular active tests. We will also check the passive monitoring graphs again to see how the iperf transfers affected our hosts.
Accessing perfAdmin for Active Measurements Data
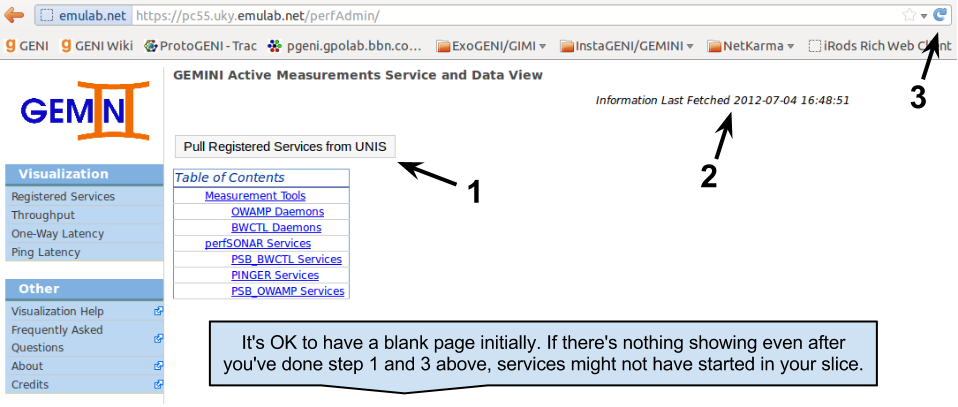
To query and visualize the active measurements data we will use perfAdmin. perfAdmin is a web service that is able to query perfSONAR services and plot relevant data. You can access a perfAdmin instance running on your slice through the portal or by going to https://<gn node>/perfAdmin (note the capitalization).
There are two sides to perfAdmin. The first side of perfAdmin is showing which services have registered to UNIS and are thus "known". The other side is querying a perfSONAR service (or set of services) for measurement data and displaying it to users.
The landing page will show which services we know about from the information on UNIS. If this is your first time opening this page, you will probably be greeted with a blank page. The services should have had enough time to start and register themselves with UNIS. We pull the information from UNIS (make sure the last fetched date changes) and then refresh the page to make sure we have the latest information.
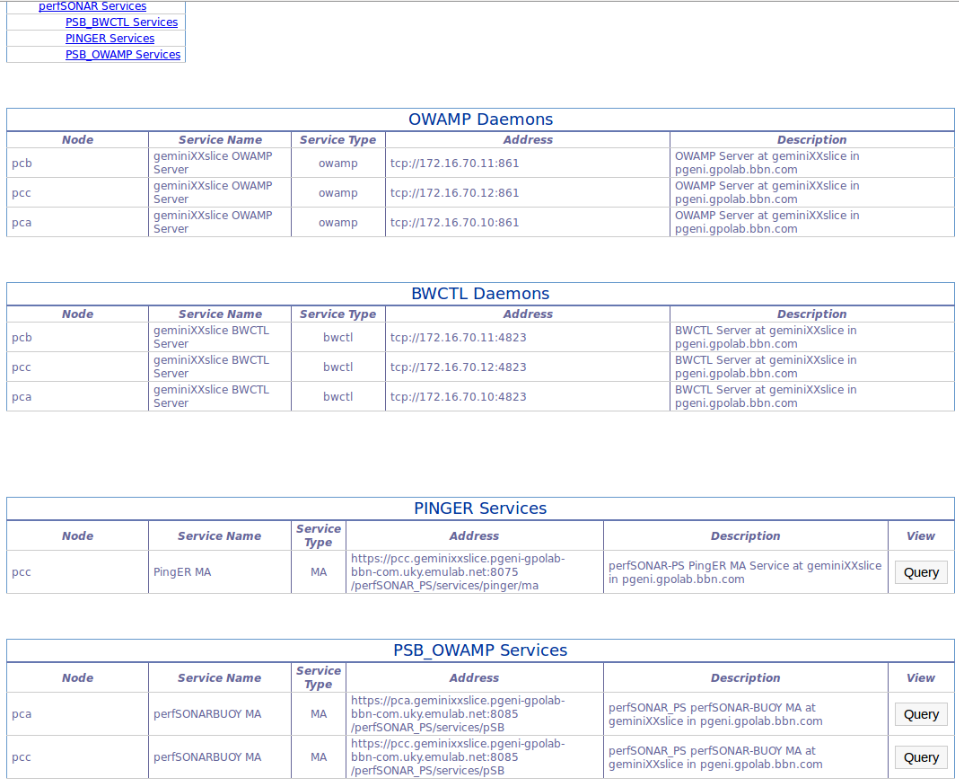
After doing this we should see all the services we enabled during the configuration section for active services. NOTE: There are many reason why services might not show: pSConfig on the node hasn't pulled the configuration from UNIS yet (see Apply Config above); the services didn't have any data to register with UNIS (services usually register every 30 minutes or when changes are detected); or there might be a problem talking to UNIS. Please contact us if you're having trouble.
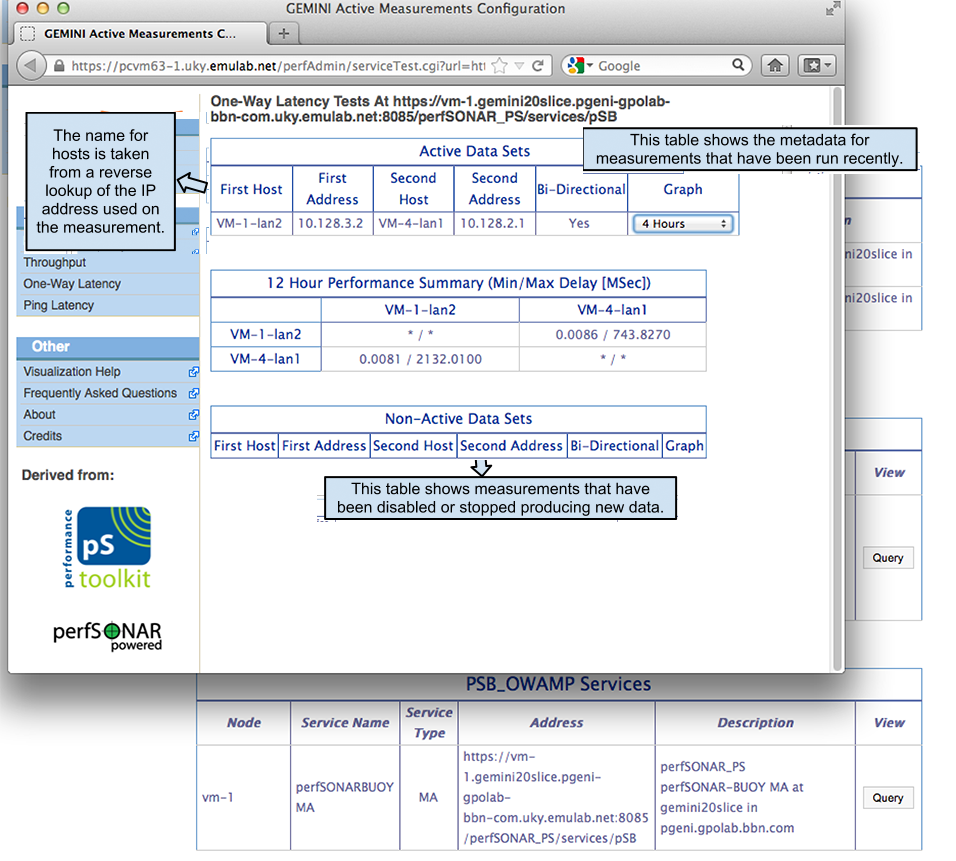
On the list of services we can see the tool daemons for OWAMP and BWCTL. We can also see the perfSONAR services storing the Ping and OWAMP data from the tests we've configured. From this page we can query a given service to see the corresponding data. The active measurement data is stored on the node that initiates the measurements and is served by a perfSONAR service running on that node. For example, we can query the perfSONAR BUOY OWAMP MA on node VM1 to see the OWAMP data from VM1 to VM4.
NOTE: When querying a single service, perfAdmin will first fetch all the metadata stored on that service. After obtaining the metadata, perfAdmin queries the service for data in order to build summaries and distinguish between active and inactive data sets. This process may take some time if there are many measurements stored on a given service.
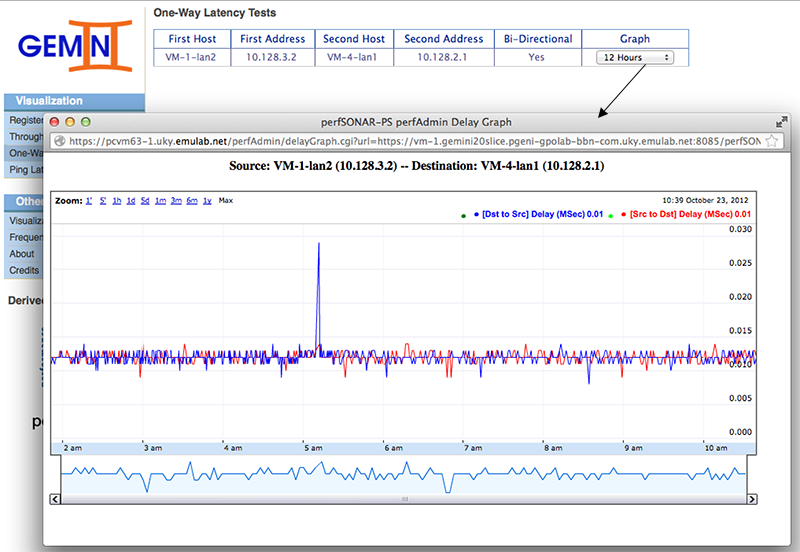
In this particular case we only have one OWAMP measurement stored at this service. We can graph by selecting a time range from the select box. perfAdmin will query the service for all data points within the last X hours and plot those (data points might be aggregated depending on granularity). The graphs are a little bit interactive, e.g. you can mouse over different data points and see the values for each direction.
The graph above shows two spikes measured latency and a lost packet during one of those. These spikes correspond to the iperf data transfers where we were saturating the links.
We can access the Ping data from our scheduled test in a similar way. Going back to our Registered Services page, this time we access the PingER service on node VM4.
While it's good to be able to query each service for its data, sometimes it's better to have access to all measurements in our slice on the same page. perfAdmin provides this option on the left menu for each of the regular testing measurement types currently supported (One-way Delay, Ping and Throughput). When we access one of these pages, perfAdmin will query each known service storing measurements of the given type for all the related metadata. It then builds a single page that we can use to query for a particular measurement's data. For example, if we go to the One-Way Delay page we should be able to see the measurements stored in both nodes VM1 and VM4.
Changes in Passive Monitoring Graphs
Using the GEMINI Portal, you can also view the changes in Passively monitored Network traffic and system resources when running any experiment or traffic or any other kind of load on the nodes in your slice.
Move selected collected measurements and other artifacts from storage service to long-term archive service
- identify archived objects with persistent identifier
- include policy for sharing with others
- allow retrieval for further analysis and visualization
Release experiment resources
Attachments (37)
- 0-unis.png (223.9 KB) - added by 12 years ago.
- 1-vm1-config.png (198.3 KB) - added by 12 years ago.
- 2.0-unis-push.png (184.9 KB) - added by 12 years ago.
- 2-vm4-config.png (199.5 KB) - added by 12 years ago.
- 4-owamp-vm1-vm4-config.png (117.7 KB) - added by 12 years ago.
- 6-owamp-vm1-vm4-config.png (138.0 KB) - added by 12 years ago.
- 8-pinger-vm4-vm1-config.png (135.6 KB) - added by 12 years ago.
- 09-pinger-vm4-vm1-config.png (156.3 KB) - added by 12 years ago.
- 10-unis-push.png (82.8 KB) - added by 12 years ago.
- 11-psconfig-apply.png (162.8 KB) - added by 12 years ago.
- perfadmin-owampgraph.2.png (172.4 KB) - added by 12 years ago.
- perfadmin-owampsingle.png (148.8 KB) - added by 12 years ago.
- perfadmin-pinger.png (228.3 KB) - added by 12 years ago.
- perfadmin-portal.png (284.7 KB) - added by 12 years ago.
- perfadmin-pull.png (104.9 KB) - added by 12 years ago.
- perfadmin-services.png (212.9 KB) - added by 12 years ago.
- psconfig-apply.png (48.5 KB) - added by 12 years ago.
- psconfig-main.png (150.9 KB) - added by 12 years ago.
- psconfig-managepca.png (168.2 KB) - added by 12 years ago.
- psconfig-managepcbpcc.png (172.8 KB) - added by 12 years ago.
- psconfig-managepush.png (189.9 KB) - added by 12 years ago.
- psconfig-managepushfailure.png (39.3 KB) - added by 12 years ago.
- psconfig-managepushsuccess.png (50.5 KB) - added by 12 years ago.
- psconfig-managevm1.png (92.2 KB) - added by 12 years ago.
- psconfig-portal.png (169.6 KB) - added by 12 years ago.
- psconfig-schedule.png (99.4 KB) - added by 12 years ago.
- psconfig-schedule-pcacreate.png (87.1 KB) - added by 12 years ago.
- psconfig-schedule-pcasave.png (89.2 KB) - added by 12 years ago.
- psconfig-schedule-pccowd.png (85.0 KB) - added by 12 years ago.
- psconfig-schedule-pccping-add.png (100.1 KB) - added by 12 years ago.
- psconfig-schedule-pccping-save.png (52.5 KB) - added by 12 years ago.
- psconfig-schedule-push.png (78.7 KB) - added by 12 years ago.
- psconfig-secexception.png (174.5 KB) - added by 12 years ago.
- psconfig-usercert.png (122.0 KB) - added by 12 years ago.
- s6.png (43.8 KB) - added by 12 years ago.
- perfadmin-vm1.png (327.8 KB) - added by 12 years ago.
- perfadmin-owampgraph.png (145.8 KB) - added by 12 years ago.

