
| Version 38 (modified by , 13 years ago) (diff) |
|---|
Slice Portal
What is it?
The INSTOOLS Portal gives a graphical overview of an experiment and quick access to each node's measurements. Through the Portal you can:
- see the experiment's topology
- display measurement graphs for a node or link, updated in real time
- access each node's Live View web page
- access each node via VNC
- create an Archive point
- access Archived points
Quick Start
- The Experiment's Slice must have been instrumentized using INSTOOLS.
- Go to the Portal, https://portal.uky.emulab.net/ . Please accept our self-signed certificate.

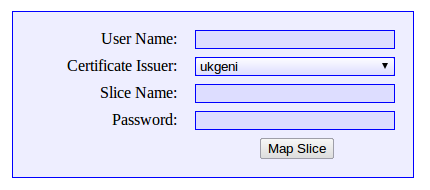
- Enter your slice information into the log on form.
- User Name used to create the slice.
- Certificate Issuer the certificate issuer (clearinghouse) associated with your User Name.
- Slice Name name of slice to be shown.
- Password password given when slice was instrumentized.
- Click Map Slice button to see the mapped layout of the slice topology.
INSTOOLS Portal Interface
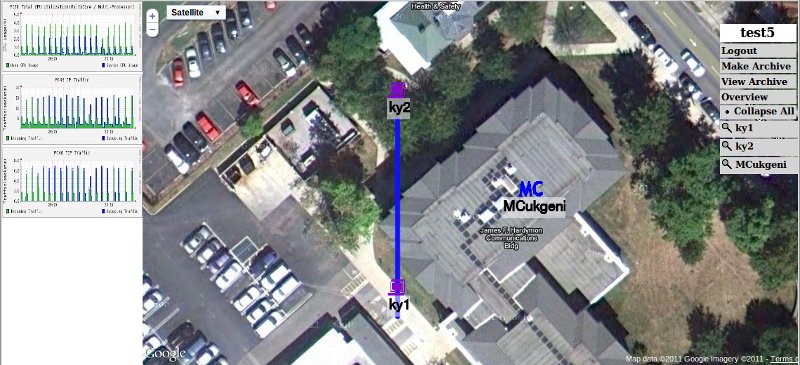
The Portal uses Google Maps to display the network topology for the given slice. The main map components are:
- Machine node displayed at it's geographical location.

- Measurement Controller (MC) displayed at it's geographical location.

- Links are displayed as lines connecting the nodes.

- Menu displayed on the right along with Zoom and Centering controls for each machine node and MC.

- Chosen Graphs will be displayed on the left. These are updated every 5 seconds. Mouse over them to enlarge.


Available Actions
Menu Controls

- Top item is the Slice Name.
- Logout to logout of the portal.
- Make Archive displays the control to create an Archive point.
- View Archive brings up the Instrumentation Tools Archive Site.
- Collapse All or Expand All expands or collapses nodes that are in the same geographic location. Expanded nodes are relocated so that they are all visible instead of collocated.
- Node Name Each node is listed. Click on the magnifying glass to zoom in and center the node. Click on the name to just center the node on the screen.
Control forms
Clicking on a Machine Node, MC or Link line brings up a Control form
- Machine Node

- Link to the node's Live View page (All Graphs).
- Link to the node's VNC for access to the machine's Desktop (VNC).
- A list of check boxes for showing the node's graphs. Checked graphs are shown to the left.
- MC
- Link to the MC's INSTOOLS Live View(Main Page)
- Link
- A list of check boxes for showing the link's graphs. Checked graphs are shown to the left.

Graphs
To add a graph, open the control form for the node or link by clicking on it. Select the check boxes and the corresponding graphs will be shown on the left of the page. Mouseover a graph to enlarge it. Click on a graph to bring up the control form for it. Double click a graph to open it into its own window.
Attachments (8)
-
terminal_purple.png (201 bytes) - added by 13 years ago.
machine icon
- mc.png (242 bytes) - added by 13 years ago.
-
log_on.png (8.9 KB) - added by 13 years ago.
log on screen
- link_line.png (2.6 KB) - added by 13 years ago.
-
menu.png (19.7 KB) - added by 13 years ago.
sample menu
-
sample_graph.png (24.1 KB) - added by 13 years ago.
sample graph
-
machine_control_checked.png (10.1 KB) - added by 13 years ago.
checked machine control
-
portal_overview.jpg (86.5 KB) - added by 13 years ago.
INSTOOLS Portal Overview
Download all attachments as: .zip