
| Version 21 (modified by , 11 years ago) (diff) |
|---|
Custom Experiment on InstaGENI with GEMINI
1. Goals
- Configure the "User Workspace" VM
- Start an InstaGENI slice
- Modify the request RSpec to include experiment-specific functions
- Use Omni to create slivers at the chosen aggregates
- Use Flack to view and modify the experiment properties as well as view slice status
- Instrument the slice with GEMINI and configure some measurements using the GENI Desktop
- Configure nodes using the command line to setup the experiment
- Run an experiment using scripts to control the node interface properties
- View results and explore the GEMINI services
2. Experiment Overview
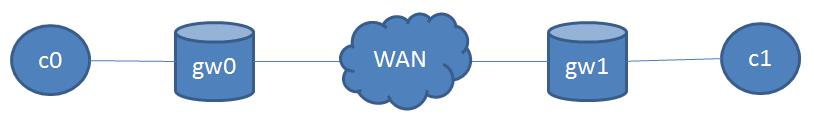
This custom experiment will make use of a WAN accelerator service called Phoebus. Phoebus can help transfer performance of TCP flows over long-distance, or "challeneged", network environments through path segmentation, protocol adaptation, and automatic protocol tuning. Phoebus Gateways (PGs) are typically installed on nodes bordering WAN link(s), segmenting the WAN path from the edge networks (e.g., campus or data centers). This experiment will create a simple 4-node topology over which to test the operation of Phoebus when used with a common network benchmark. To simulate WAN latencies and edge loss, we will use the netem (Network Emulator) module in Linux to modify how packates are handled across the experimental topology. GEMINI will be used to verify connectivity and to collect some performance data.

The image above shows the topology we will create on InstaGENI. We will make some assumptions about addresses assigned to each interface to help with the consistency of this tutorial.
client0 : 10.10.1.1
gateway0 : 10.10.1.2 and 192.168.1.1
gateway1 : 192.168.1.2 and 10.10.2.2
client0 : 10.10.2.1
This IP assignment will give us 3 distinct subnets over which to send traffic. 10.10.1.0/24 (edge 0), 192.168.1.0/24 (WAN), and 10.10.2.0/24 (edge 1) Host routing will be necessary to allow IP fowarding across each subnet.
More information about Phoebus can be found here and here
3. Setting up your user environment
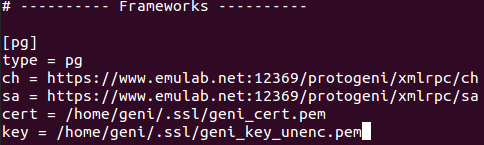
Follow these instructions to configure Omni http://trac.gpolab.bbn.com/gcf/wiki/OmniConfigure/Automatic
Now we want to decrypt our private key so Omni won't have to repeatedly prompt for the key password.


4. Create the experiment slice
OUr experiment topology will be generated in Flack on InstaGENI racks at Kentucky and Utah.
Use the "Flack GENI Client" link in the bookmarks par to load the Flack interface.
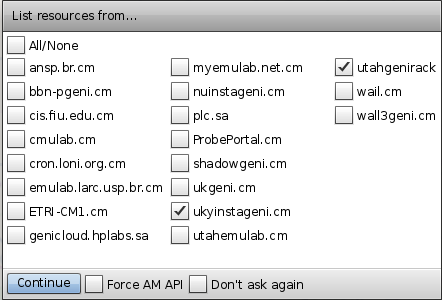
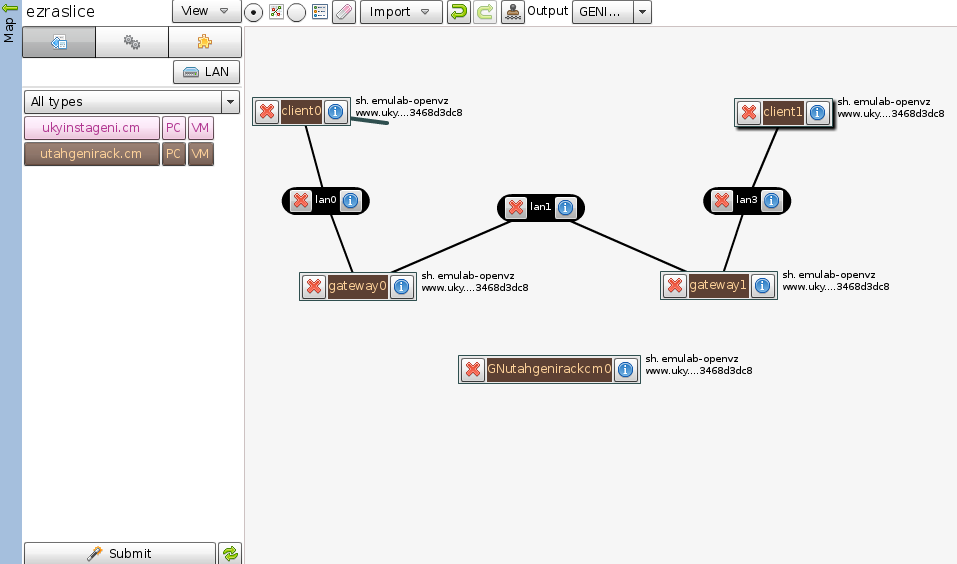
Select UKY and Utah instageni AMs.

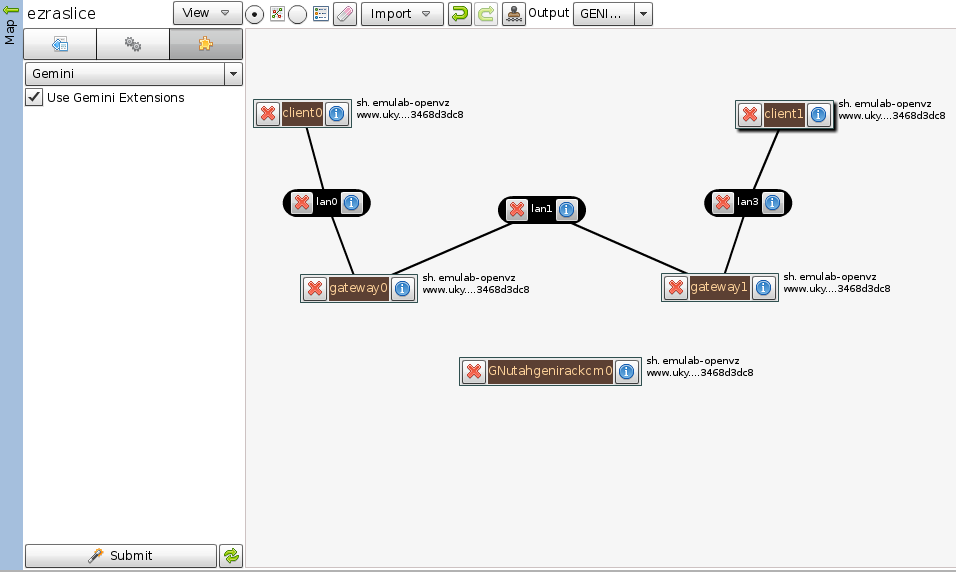
Create your topology as shown using VM nodes from either UKY or Utah.

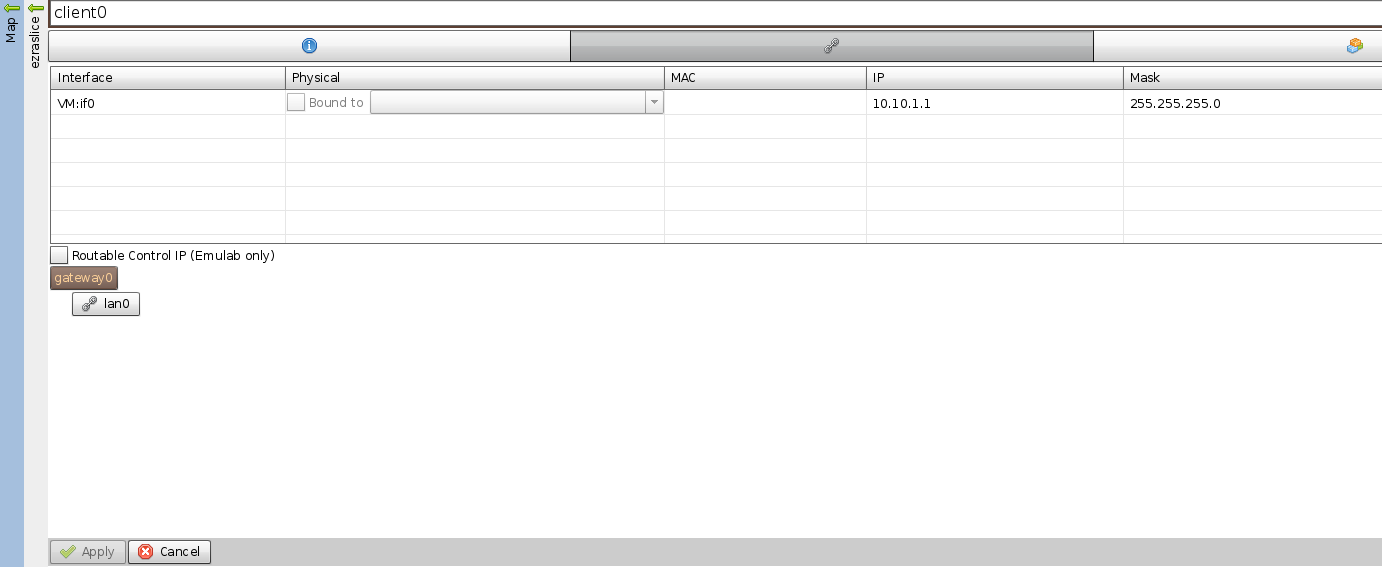
Click on the "i" on each node to configure additional properties, such as the node name and the desired IP addresses.

To allow for GEMINI instrumentation, enable the GEMINI extensions in the right-most tab as shown in the screenshot. Selecting this extension will automatically create an additional node in your experiment for measurement configuration and collection.

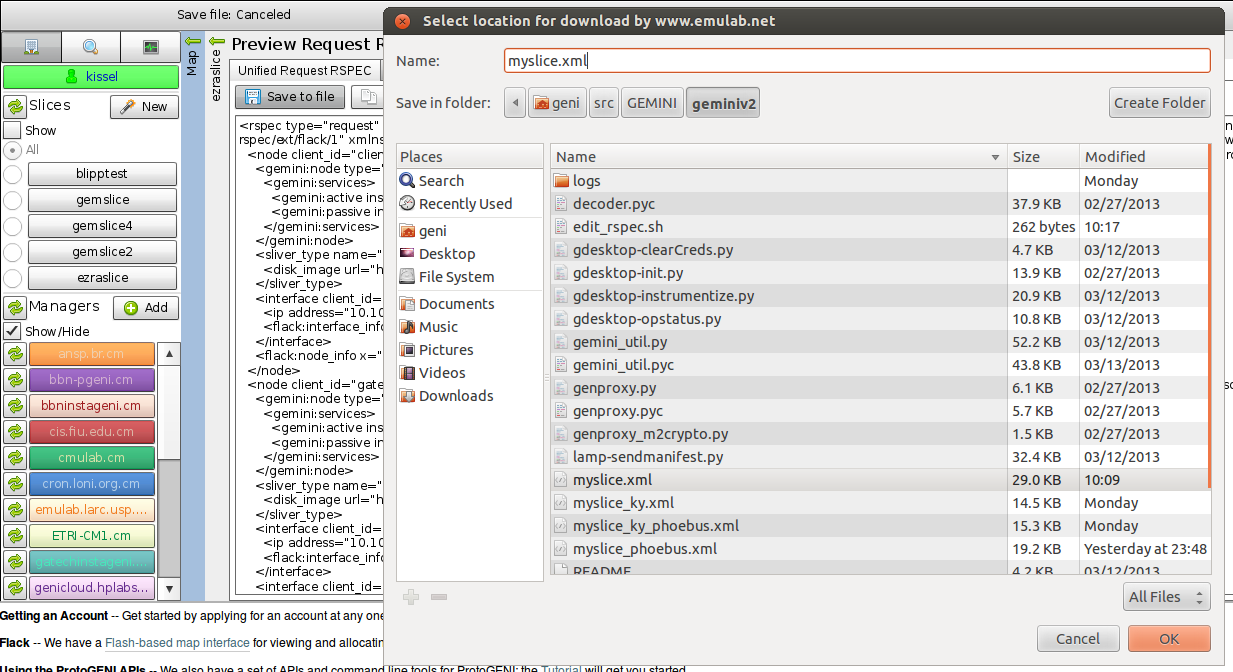
To modify the request RSpec in the following steps, you need to save the RSpec to your local filesystem. Click on View->Request RSpec to display the XML representation of your topology and save to file as shown.

Now we do some editing of the request RSpec. Either download or save the following script in your working directory.
#!/bin/bash

FILE=$1

TEXT_ADD="\
   <services>\n\
       <execute command='wget -q -P /tmp http://stout.inctre.iu.edu/~kissel/phoebus/phoebus_install.sh;sudo bash /tmp/phoebus_install.sh' shell='sh'/>\n\
   </services>"

sed "/\/node\>/ i\ ${TEXT_ADD}" ${FILE}
$ ./edit_rspec.sh myslice.xml > myslice_phoebus.xml
The script adds extra service elements to each node that will allow a custom script to be executed when the node boots. In our case, this script will download and install the Phoebus software packages and other supporting scripts needed for the experiment. Your own experiments may have many such scripts, each of which is completely customizeable.
At this point our request RSpec is ready to go. We now want to interact with the GENI control framework to instantiate our experiment. In this tutorial, we will use Omni.
For convenience, the complete request RSpec for a Utah sliver is available here
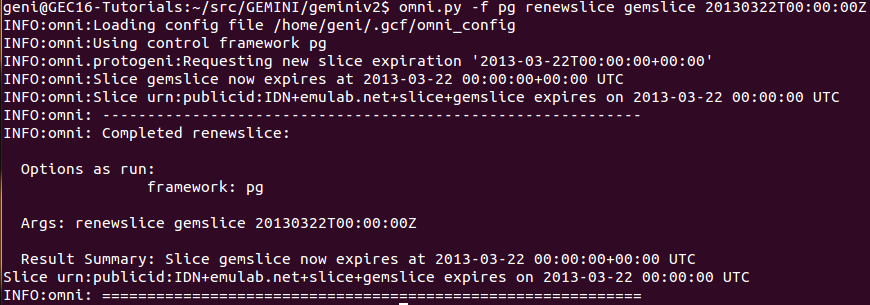
First, renew the slice created in Flack via Omni.

You now want to invoke "createsliver" to create the slivers at each AM involved in your experiment topology. In our case, this is either ig-utah or ig-ky as configured in your Omni configuration file.

After the request is submitted, Omni can be used to monitor the slice status. More conveniently, you can reload the slice in Flack and watch the progress until your slice display turns green.
5. Instrument the slice
Now that the slice is created, you may instrument the slice with GEMINI. The GENI Desktop provides this same functionality via a browser interface, but here we will use the "instrumentize" scripts available on the UW VM.
Note that you specify your slice name and the location of your SSL certificate when executing these scripts.
geni@GEC16-Tutorials:~/src/GEMINI/geminiv2$ ./gdesktop-init.py -n ezraslice2 -f ~/.ssl/geni_cert.pem
geni@GEC16-Tutorials:~/src/GEMINI/geminiv2$ ./gdesktop-instrumentize.py -n ezraslice2 -f ~/.ssl/geni_cert.pem
Once these scripts return, your slice has been instrumentized and will begin collecting default, passive measurements. We will visit the GENI Desktop in later sections, but while the slice is being instrumented, we can use this time time to login and configure our nodes for our experiment.
6. Login and configure experiment nodes
ssh to each of the nodes in the experiment. Become root with 'sudo su'.
We will now add host routes so the client nodes in the experiment can talk to each other across the GW systems.
On client0:
$ route add -net 10.10.2.0/24 gw 10.10.1.2
On gateway0:
$ route add -net 10.10.2.0/24 gw 192.168.1.2
On gateway1:
$ route add -net 10.10.1.0/24 gw 192.168.1.1
On client1:
$ route ad -net 10.10.1.0/24 gw 10.10.2.2
From client0, you should now be able to ping and traceroute to client1:
$ ping 10.10.2.1
PING 10.10.2.1 (10.10.2.1) 56(84) bytes of data.
64 bytes from 10.10.2.1: icmp_req=1 ttl=62 time=0.054 ms
64 bytes from 10.10.2.1: icmp_req=2 ttl=62 time=0.062 ms
64 bytes from 10.10.2.1: icmp_req=3 ttl=62 time=0.067 ms
^C
--- 10.10.2.1 ping statistics ---
3 packets transmitted, 3 received, 0% packet loss, time 1999ms
rtt min/avg/max/mdev = 0.054/0.061/0.067/0.005 ms
$ traceroute 10.10.2.1
traceroute to 10.10.2.1 (10.10.2.1), 30 hops max, 60 byte packets
 1  gateway0-lan0 (10.10.1.2)  0.049 ms  0.013 ms  0.011 ms
 2  gateway1-lan1 (192.168.1.2)  0.031 ms  0.017 ms  0.016 ms
 3  10.10.2.1 (10.10.2.1)  0.028 ms  0.022 ms  0.021 ms
7. Configure measurements
Login to the GENI Desktop using the bookmark in Firefox. link
Note that this step requires that you first login to your Slice Authority Emulab site.
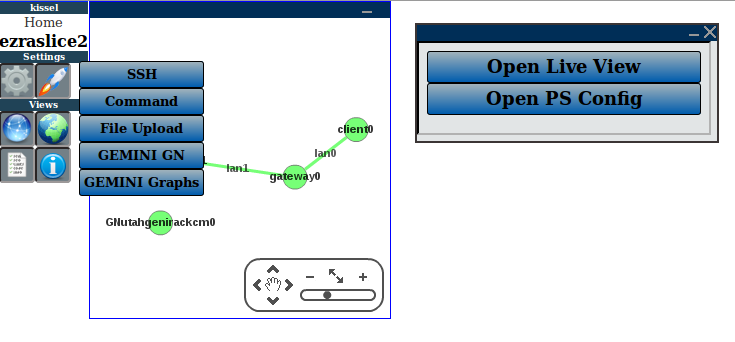
Explore the desktop.
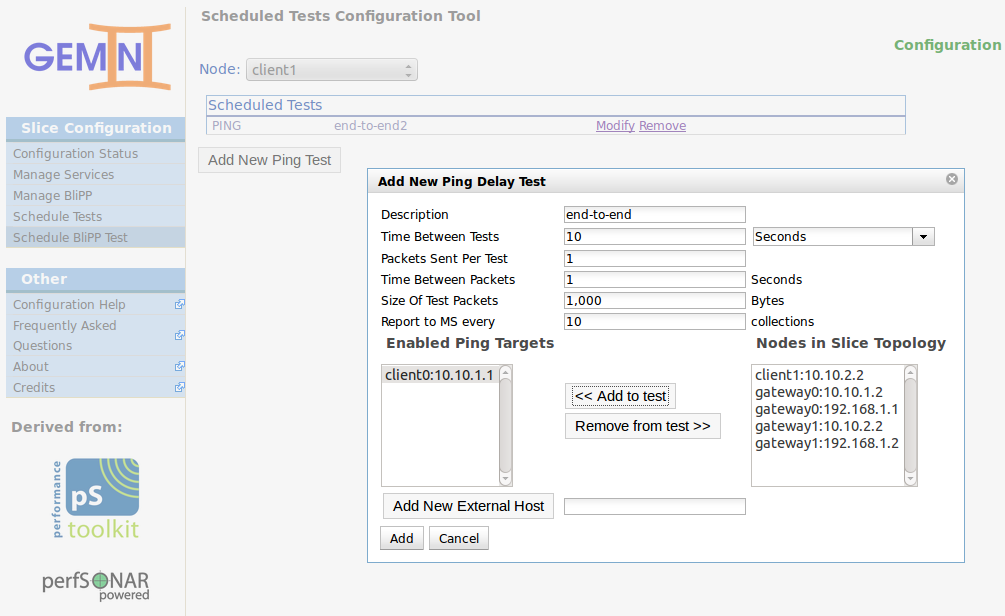
For our experiment, we'd also like to measure the latency across all of our nodes. We can use the active measurement configuration page to do so.
Click on the buttom labeled "Open PS Config".

You may add new ping tests under "Schedule BLiPP Test".

8. Run experiments
We now want to configure some latency between the nodes in our experiment and generate some baseline performance numbers.
On gateway0 and gateway1, run:
$ sh /tmp/setup_netem.sh <iface> 20 0
Substitute the interface names assocatiated with 192.168.1.1 and 192.168.1.2. After running this script, 20ms of latency will be added to outgoing packets from each interface on the gateway nodes. If you ping between client0 and client1, you should now see 40ms RTT.
Now lets see how a network benchmark peforms. We will use IPerf, a common benchmarking tool for this purpose. client1 will be our iperf server and client0 will be our traffic source, sending data from client0 to client1.
On client1, run:
$ iperf -s
On client0, run:
$ iperf -c 10.10.2.1 -t 60 -i 2
You should see a transfer rate of close to 100Mb/s, which is the default link speed of our experiment nodes.
Now, let's make the network situation a little more complicated. We will add some edge latency and a small amount of loss to the edge 0 side.
On client0, run:
$ sh /tmp/setup_netem.sh <iface> 5 .01
This will add 5ms edge latency and .01% loss to packets leaving client0. If you run the same iperf from above once more, you should see a significant impact on the achievable transfer performance.
It's time to see if Phoebus can help in this situation. Let us start the Phoebus service on the two gateway nodes.
On each node, run (as root):
$ /etc/init.d/phoebus start
$ tail -f /var/log/phoebus
This will start the service and allow you to view the Phoebus log on each gateway node.
Now we need to make the client application (in this case iperf) use Phoebus during transfer tests. To do so, we will make use of a trsnsparent wrapper mechanism known as a "shim" library. This techique uses libray interposition via the Linux LD_PRELOAD mehcniasm to intercept socket() calls and allows them to establish connections to a series of Phoebus Gateways using a protocol known as XSP. Let us give this a try and re-run our transfer tests, this time over Phoebus.
On client0, run:
export LD_PRELOAD=/usr/lib64/libxsp_phoebuswrapper.so
export XSP_PATH=10.10.1.2/5006,10.10.2.2/5006
After running the above commands, any network application instantiated from that shell will make connections to the PGs specified in the XSP_PATH environment variable. Try this with the same iperf test from above. You should now see a much improved transfer performance, even approaching that of the non-loss case from earlier.
You may experiment with the scripts and try different latency and loss cases. For repeated tests, or to do parameter sweeps, these scripts can be further integrated and looped to do a number of long-lived tests.
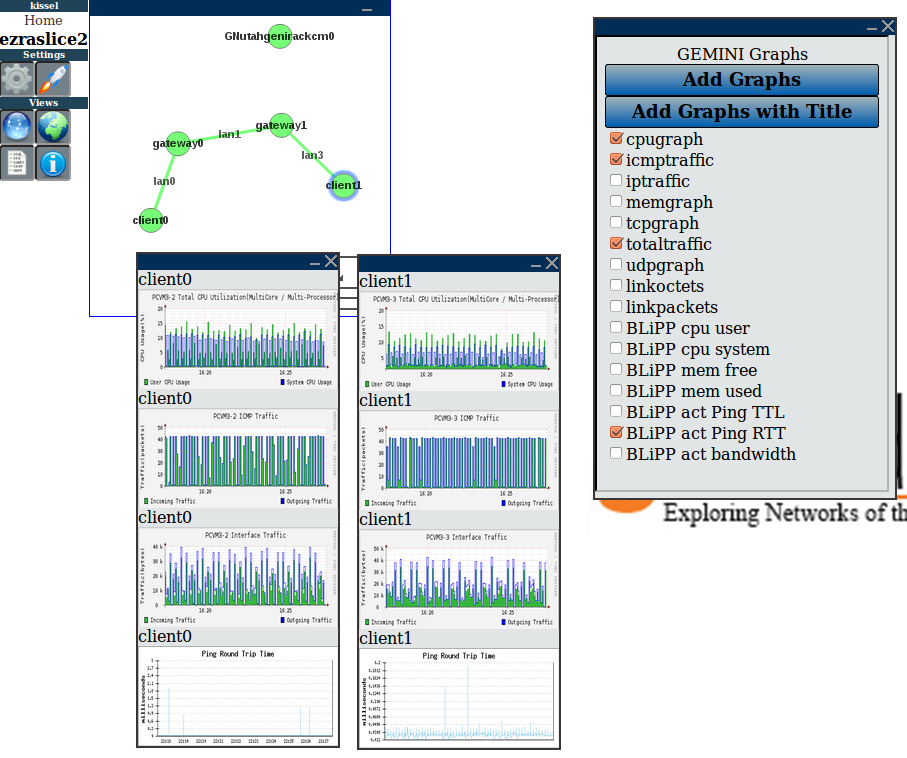
9. View results
Visualization of passive and configured active masurements may be viewed directly from the GENI Desktop interfaces.
During the tutorial, we will also go hands-on with some methods for gathering, querying, and displaying measurement data from the command line.

Attachments (17)
- decrypt_geni_key.png (15.4 KB) - added by 11 years ago.
- omni_config_key.png (10.2 KB) - added by 11 years ago.
- omni_create_uky.png (81.9 KB) - added by 11 years ago.
- omni_renew_slice.png (55.2 KB) - added by 11 years ago.
- select_am.png (16.8 KB) - added by 11 years ago.
- phoebus_exp.PNG (10.6 KB) - added by 11 years ago.
- flack_config_node.png (23.0 KB) - added by 11 years ago.
- flack_gemini_button.png (45.5 KB) - added by 11 years ago.
- flack_save_request.png (227.7 KB) - added by 11 years ago.
- flack_topo.png (50.2 KB) - added by 11 years ago.
- myslice.xml (29.0 KB) - added by 11 years ago.
- edit_rspec.sh (262 bytes) - added by 11 years ago.
- desktop_psconfig.png (39.7 KB) - added by 11 years ago.
- psconfig_ping.png (94.6 KB) - added by 11 years ago.
- desktop_graphs.png (245.1 KB) - added by 11 years ago.
- myslice_phoebus.xml (29.9 KB) - added by 11 years ago.
- myslice_phoebus_ky.xml (29.8 KB) - added by 11 years ago.
Download all attachments as: .zip