
| Version 9 (modified by , 10 years ago) (diff) |
|---|
Use Cases
This page describes the priority use cases. There is also a summary of all requested use cases
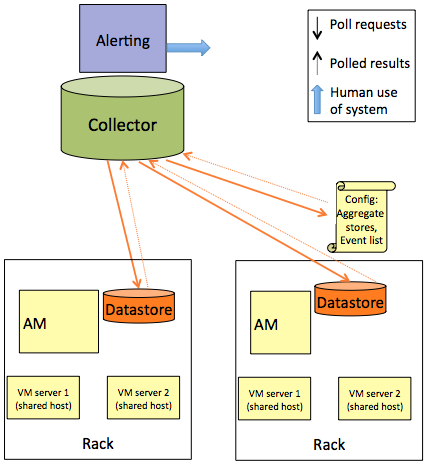
Rack Health
Use case description: Track node compute utilization, interface, and health statistics for shared rack nodes, and allow operators to get notifications when they are out of bounds (UC 3)
Use case implementation story: Node statistics are time-series data, and are either collected on the node and pushed to the compute aggregate, or polled from each node by the compute aggregate (doesn't matter for our purposes). Statistics end up in a local database on each rack. Any group of operators that wants to send notifications on these statistics runs a collector, which polls all racks of interest to that group. The collector shares current values with an alerting service, which sends alerts.
 |
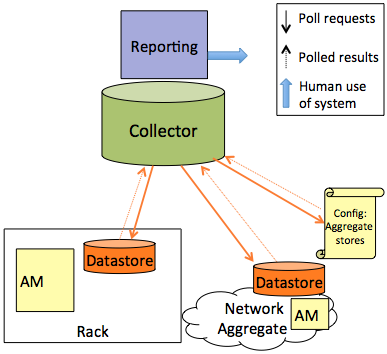
Sliver Allocations
Use case description: Find out what slivers will be affected by a maintenance or outage of some resource, and get contact information for the owners of those slivers so targeted notifications can be sent (UC 6)
Create reports on GENI utilization over time, broken down by distinct experimenter, what resources were used, and when (UC 13)
Use case implementation story: Aggregates collect up-to-date information about what slivers exist and what resources they have reserved (including sliver details such as expiration time), and make this information available via a local datastore. GENI trust authorities (e.g. clearinghouses) collect up-to-date information about experimenters and their contact information, and make this information available via a local datastore. Operators who want to be able to get this information run a collector which can query the relevant datastores (since this is an on-demand real-time query, the collector doesn't need to be active all the time, though it may be). The collector data is used to run a report listing affected experimenters and their contact info.
 |
Control Plane and Data Plane Monitoring
This section describes the different components necessary to monitor the control and data planes.
Control plane use case:
- Run remote reachability checks of GENI network-listening services including GENI AMs and important non-AM services, and receive notifications when these checks fails. (UC 4)
- Receive notifications when rack, regional, and core control planes are down or when utilization is too high. (UC 5)
- Report (and eventually visualize) the breakdown of control plane traffic by experiment. (UC 5)
Dataplane use case:
- Receive notifications of dataplane connectivity failure between GENI sites, including sites which are totally unreachable, shared interfaces which are down, interfaces whose utilization is too high, and experimental VLANs which can't be used successfully. (UC 7)
- Share results of dataplane connectivity testing among operators to use the network efficiently. (UC 7)
- Visualize dataplane network performance across GENI, including interface counters at multiple points along core and regional networks, and into and out of each rack. (UC 8)
Aggregate Datastores for Control and Data Plane Monitoring
 |
External Checks Datastore for Control and Data Plane Monitoring
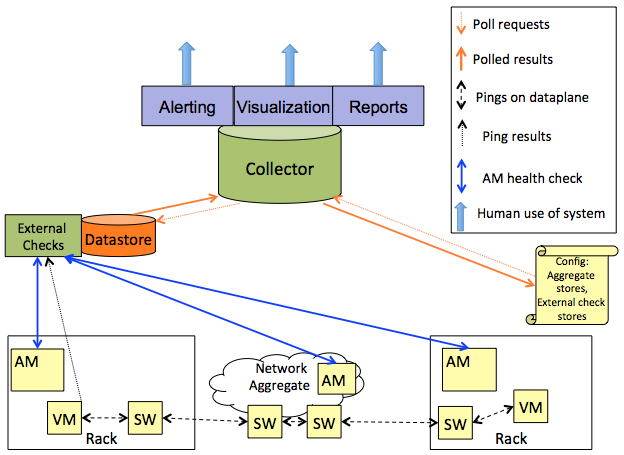 |
Attachments (4)
- use_case_3.png (50.7 KB) - added by 10 years ago.
- use_case_6.png (43.0 KB) - added by 10 years ago.
- extck_store_cp_dp.png (74.1 KB) - added by 10 years ago.
- agg_store_cp_dp.png (78.1 KB) - added by 10 years ago.
Download all attachments as: .zip