
| Version 5 (modified by , 10 years ago) (diff) |
|---|
Overview of Operational Monitoring
Introduction
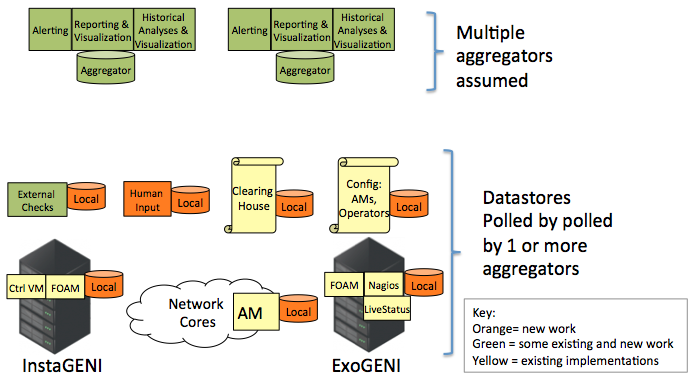
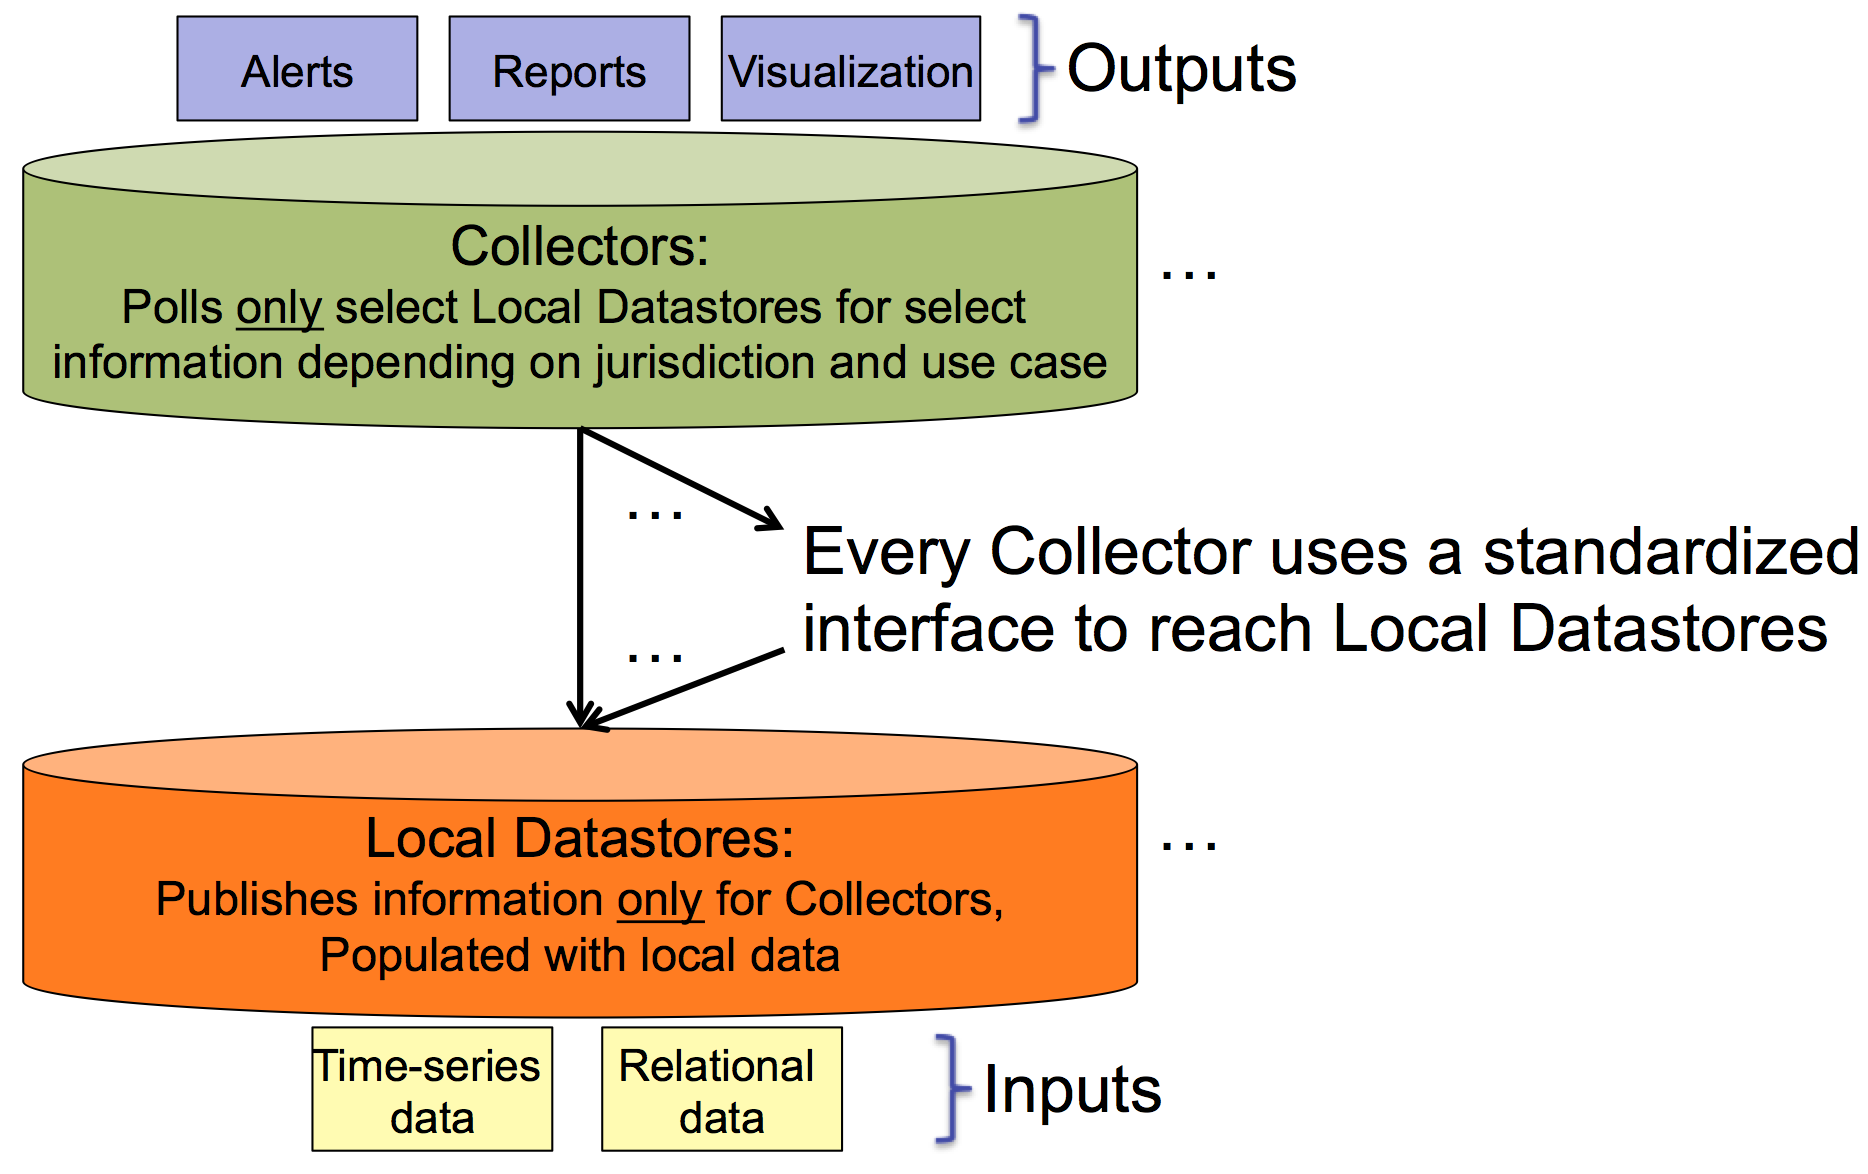
The monitoring architecture is based on the concept of distributing sources of information in a common fashion. The sources of information (relational data or time-series data) is placed into what are called "Local Datastores". These datastores have a common REST polling API for retrieving information. The component that automatically retrieves data from the Local Datastores are called "Aggregators".
 |
An aggregator can poll a variety of datastores and any subset of data within each datastore. A monitoring application relies on an aggregators for its data queries, so aggregators poll whatever data is necessary to have sufficient data to support the attached monitoring applications (i.e., alerting, reporting, historical analysis, visualization).
 |
Although there are multiple aggregators, a single monitoring application uses only a single aggregator.
Use Cases
Detail of proposed monitoring system components for (use case 3)
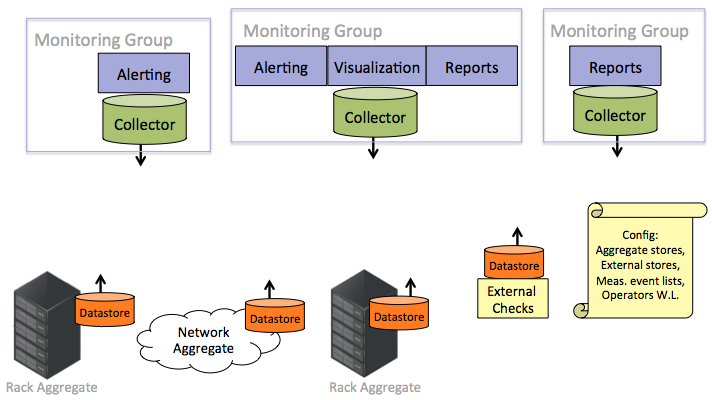
Use case description: Track node compute utilization, interface, and health statistics for shared rack nodes, and allow operators to get notifications when they are out of bounds
Use case implementation story: Node statistics are time-series data, and are either collected on the node and pushed to the compute aggregate, or polled from each node by the compute aggregate (doesn't matter for our purposes). Statistics end up in a local database on each rack. Any group of operators that wants to send notifications on these statistics runs an aggregator, which polls all racks of interest to that group. The aggregator shares current values with an alerting service, which sends alerts.
 |
Attachments (3)
- monitoring_architecture.png (91.7 KB) - added by 10 years ago.
- local_datastores_collectors.png (181.6 KB) - added by 10 years ago.
- GENI_implementation.png (79.6 KB) - added by 10 years ago.
Download all attachments as: .zip