
| Version 4 (modified by , 12 years ago) (diff) |
|---|
OnTimeMeasure - Custom Metric Integration Documentation
Prasad Calyam, Yingxiao Xu
October 24, 2011
Software License: 'GENI Project License (GPL)'
1. Background
This document describes the concept, steps and case studies on how experimenters can add custom measurements (at host or network levels) in their application into OnTimeMeasure.
OnTimeMeasure is an extensible measurement framework for both active and passive measurements within GENI experiment slices. It provides measurement data aggregation, visualization, analysis and archive for GENI experimenters and operators. For more information, please see - Project Wiki
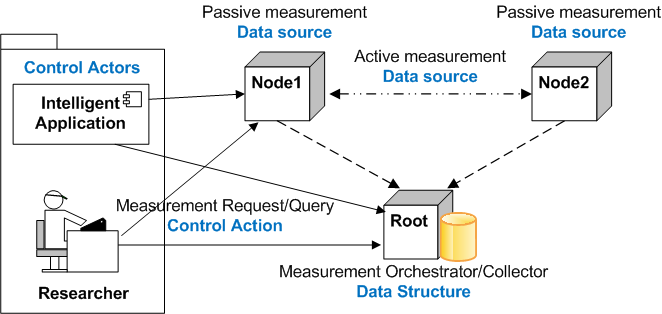
To integrate your custom measurement metrics in your application into OnTimeMeasure, you will need to provide information on: Control Actors, Control Actions, Data Sources and Data Structures.

- Control Actors: Project members or your research experiment who can provide the “slice password” to the OnTimeMeasure instance in an experiment slice, and would access the I&M data or share the data with other actors
- Data Sources: Data generation tools deployed in slice nodes; the tool would communicate with other nodes to perform active measurements or inherently collects passive measurements in on-going and on-demand manners
- Data Structures/Data Types: Measurement data that needs to be stored in a database with appropriate data structure and data types
- Control Actions: Control both start and stop of the data generation tool, control how to retrieve and utilize the data e.g., dashboard, plots, time series files with anomaly annotation
Above information would be specified in a configuration file, and integrated into OnTimeMeasure through web services.
2. Steps for Custom Metric Integration
2.1 Specify custom metric information
Let us consider an example of "FrameLength" metric for illustration purposes below.
Metric
    FrameLength corresponding to size of HTTP data packets
Control Actor
    Experimenters at Purdue University who have the slice password of their !OnTimeMeasure nodes
Data Source
    Wireshark packet capture tool; command line option to collect measurements is:
           tshark -i eth0 -V -R "http" -T fields -e ip.src -e ip.dst -e frame.len -a duration:
Data Structures/Data Types
    The measurement results are stored in a database table with the following fields:
           tsharkDt (timestamp), SrcAddress (varchar(25)), DstAddress (varchar(25)), Framelen (double)
    The Framelen field of measurement data can also be stored in the Graphite dashboard software by specifying -
           !SrcAddress.Framelen
Control Actions
    Tool execution time is 100 seconds
    Tool must be invoked periodically once every 10 minutes
    Tool execution does not conflict with other any tools
2.2 Compose a configuration file and add custom metric specifications
In a new configuration file FrameLengthSpecs.yaml, add the following:
Metrics:
  FrameLength:
     description: Frame Length
     tool: Tshark
     metrictype: host
Tools:
  Tshark:
    command: sudo tshark -i eth0 -V -R "http" -T fields -e ip.src -e ip.dst -e frame.len -a duration:100
    runat: <SRC>
    dbtable:
          - field: [tsharkDt, SrcAddress, DstAddress, Framelen]
            type:  [timestamp, varchar(25), varchar(25), double]
    graphite:
          - send: [Avgframelen,SrcAddress_DstAddress.Framelen]
    time: 10
    duration: 100
    conflict: []
2.3 Compose a parser file to extract the custom metric "timeseries record" from output of measurement tool
Please see FrameLengthParser.pm example written in Perl.
2.4: Add custom metric configuration file and parser file into OnTimeMeasure framework
From Researcher Web-portal (OnTimeBeacon):
Login to http://ontime.oar.net. In "Request Specification" page, select the configuration file/parser file and click the "Add Metric" button.

Or, From Command-line (OnTimeControl):
Use add_metric.py script that comes with the OnTimeControl software package.
Options for add_metric.py script are:
-c <configuration file name>
-p <parser file name>
Example:
python add_metric.py –c FrameLengthSpecs.yaml -p FrameLengthParser.pm
The custom metric FrameLength is now integrated into OnTimeMeasure!
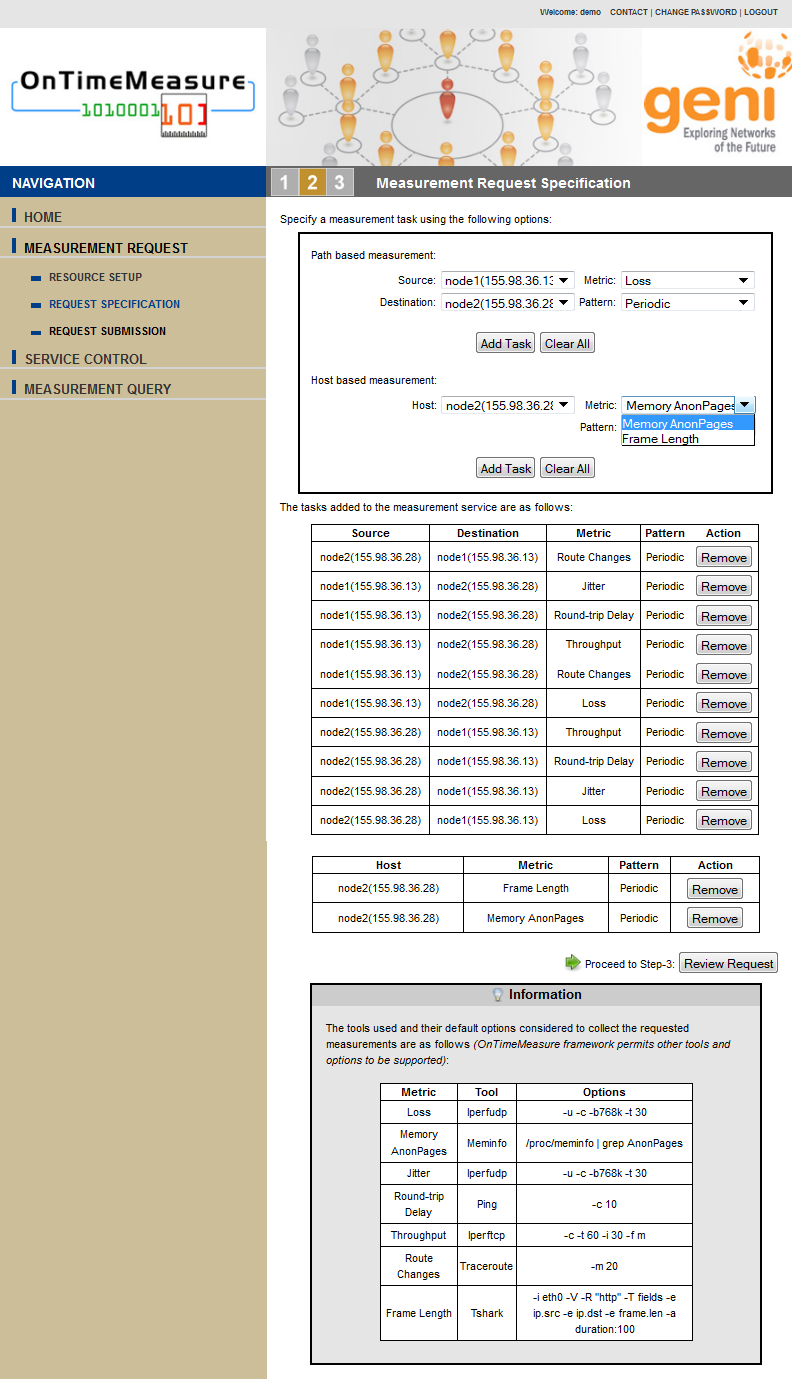
2.5 Add measurement tasks with the custom metric
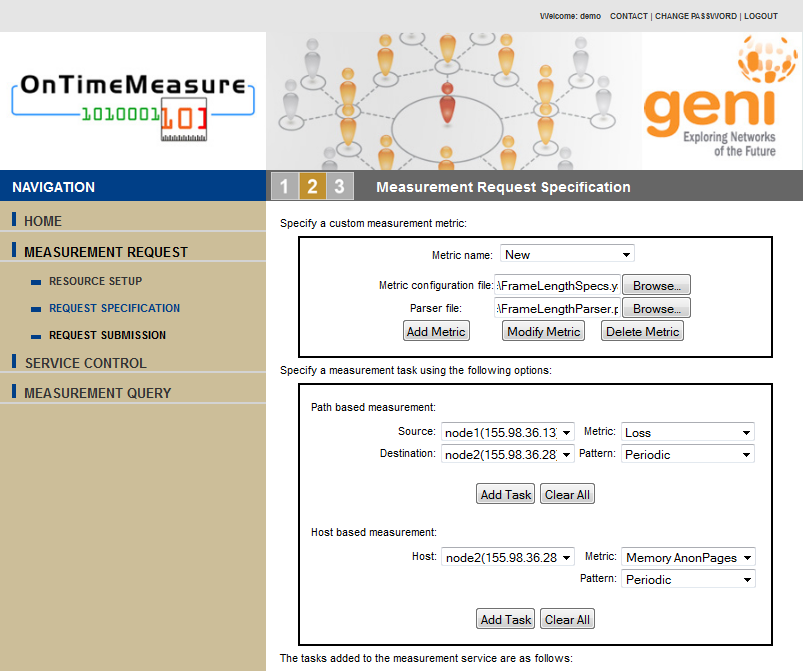
From Researcher Web-portal (OnTimeBeacon): The custom metric will appear in the "Measurement Request Specification" page to add related measurement tasks.

Or, From Command-line (OnTimeControl): "task_manage.py" in the OnTimeControl software package manages the measurement tasks (i.e., requests), which are configured in a .yaml file.
An example "measurement.yaml" is included in the OnTimeControl package with contents:
# Measurement task settings
# Hint: A space is required after ':'

##################################################
# Supported sampling patterns:
# - Periodic
# - RandomPoisson
# - RandomExponential
# - RandomGaussian
# - StratifiedRandom
# - Adaptive
##################################################
pattern: Periodic

##################################################
# Measurement links
# Please use node names as source and destination
# Supported metrics:
# - RoundtripDelay
# - Throughput
# - Loss
# - Jitter
# - RouteChanges
##################################################
links:
- source: WASH
  destination: SALT
  metric: [Throughput, RoundtripDelay, Jitter, RouteChanges]

- source: SALT
  destination: WASH
  metric: [Jitter, RoundtripDelay, Throughput, RouteChanges]

- source: SALT
  metric: [FrameLength]
Create your own measurement configuration file by following the above example and comments, and then run the "task_manage.py" with parameter "-c <measurement_config_file.yaml>".
An example:
python task_manage.py -c measurement.yaml
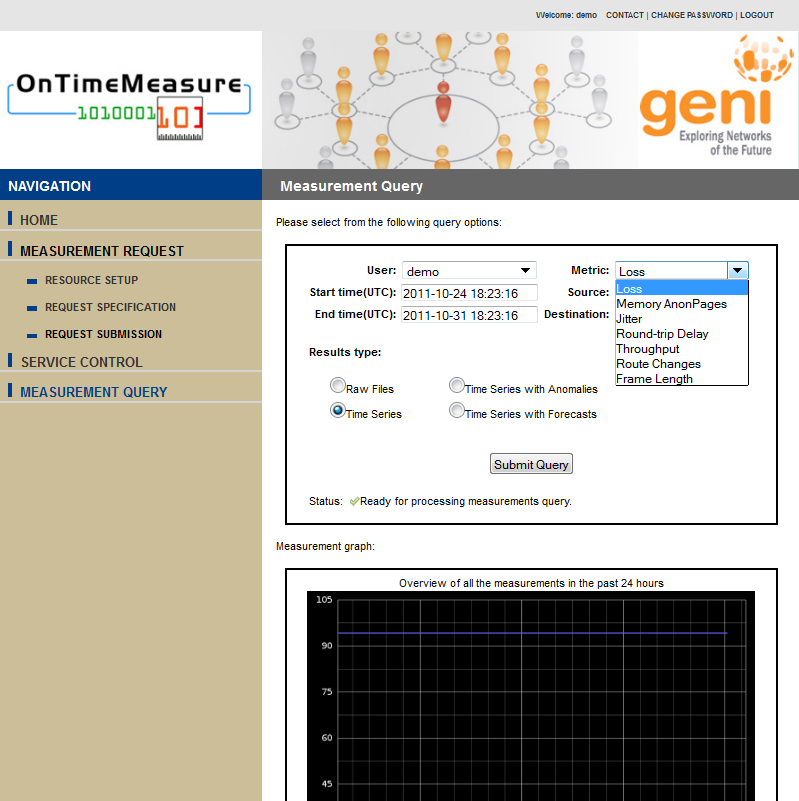
2.6: Query measurement results of the integrated custom metric
From Researcher Web-portal (OnTimeBeacon):

Or, From Command-line (OnTimeControl): Use the "query.py" in the OnTimeControl software package that has following query options:
-f from time "YYYY-MM-DD HH:MM:SS" in UTC
-t to time "YYYY-MM-DD HH:MM:SS" in UTC
-s source node name
-d destination node name
-m metric {RountTripDelay|Throughput|Loss|Jitter}
-r result type {RawFiles|TimeSeries|TimeSeriesPlusAnomalies|TimeSeriesPlusForecasts}
Measurement results queried are automatically downloaded into your local folder.
An example query:
python query.py -f "2011-10-07 18:00:00" -t "2011-11-01 20:00:00" -s SALT -m FrameLength -r TimeSeries
3. Underlying Process for Custom Metric Integration within OnTimeMeasure

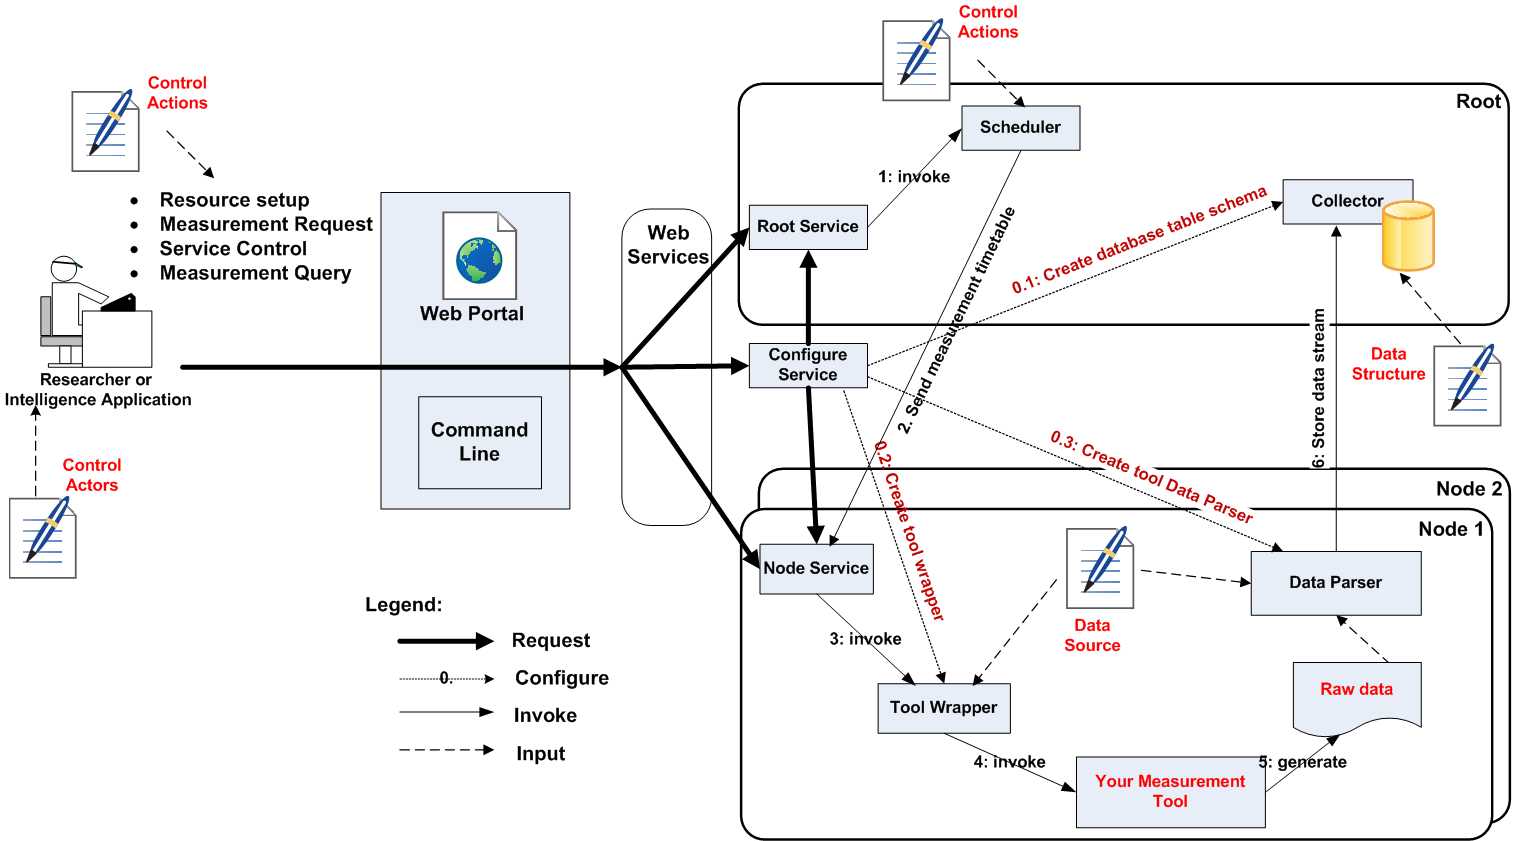
With the slice password, the Control Actor (person or program) has access to Root Beacon and Node Beacons through the Researcher web-portal (http://ontime.oar.net) or command-line tool (OnTimeControl).
The information of custom metric in the configuration file will be used to appropriately create database table schema, tool wrapper and tool data parser through a "Configure Service". More specifically, the data source information is used along with the corresponding tool wrapper to invoke your measurement tool with proper arguments. The parser you uploaded will be used to interpret the raw measurement data and convert it to a time series record that corresponds to the data structure/data types you specified. The converted time series data is stored into the database. The sampling rate specified as part of control action information is used by the measurement scheduler when generating measurement schedules to provision active measurements or inherently collect passive measurements in on-going and on-demand manners.
4. Case Study
4.1 Case Study 1: Emulating cloud dynamics for performance sensitive applications
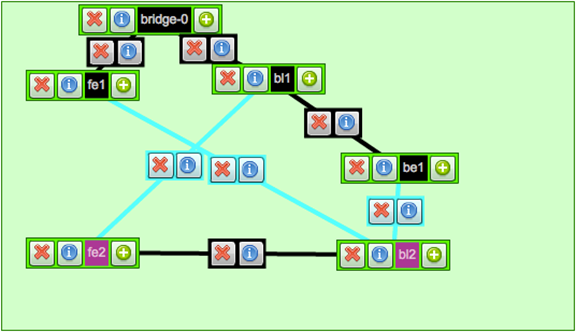
A GENI experiment being led by Purdue University aims to enable performance aware enterprise applications on the cloud and is developing adaptive systems tuned to cloud dynamics. The experiment application needs measurements of link delay and frame length across all links within a data center and across data centers.
The experiment is conducted on machines from two different data centers in Utah and Kentucky. As illustrated in figure below, node fe1, bl1 and be1 are located in Utah; Node fe2 and bl2 are located in Kentucky. A delay node (bridge-0) is deployed on the path between fe1 and bl1 nodes to change the link delays. Instrumented web applications are running on all nodes. MySQL server is installed on be1 to host the application database.

To see this experiment case study of OnTimeMeasure in action, please see demo video. The experiment uses OnTimeMeasure to measure all links delay across inter and intra federated sites periodically using Ping tool, and measures "FrameLength" of http requests across all links using Tshark periodically. The measurement results are compared and studied with various other aspects of data from the experiment application. To accomplish these measurements with OnTimeMeasure, the RootBeacon is installed on an extra node in the experiment slice, and NodeBeacons are installed on nodes f1, bl1, be1, fe2 and bl2 within the experiment slice.
4.2 Case Study 2: Resource allocation in virtual desktop clouds
A GENI experiment being led by The Ohio State University aims to develop utility-directed resource allocation schemes within virtual desktop clouds (VDCs). The schemes allocate resources (i.e., CPU, memory, network bandwidth) such that the global utility (i.e., combined utility of all virtual desktops at a data center) is maximized under the constraint that each virtual desktop at least meets it minimum quality requirement specified in service level agreements. The allocation adaptation is based on feedback of network health from the client, and CPU/memory load on the server.
To see this experiment case study of OnTimeMeasure in action, please see demo video. The detailed steps of OnTimeMeasure configuration for the custom metrics in the VDC experiment are as follows.
Step 1: Specify custom metric information
Control Actors
A VDC application script that requires end-to-end active measurements, passive measurements (i.e., packet capture) and VMware tools measurements to run the resource allocation schemes

Data Source
        VMware provides tools to access memory, CPU, network, etc. of each host.
        OSU developed a wrapper script to use the VMware tools to obtain experiment measurements.
        The command line arguments for this script are:
            VDMeasurement.exe –m cpu –m mem
Data Structure/Data type
	For CPU
            Field: cpuDt,HostAddress, CPU
            Datatype: timestamp, varchar(25), varchar(25), double
        For Memory
            Field: memDt,HostAddress,MEM
            Datatype: timestamp, varchar(25), varchar(25), double
Control Action
	Measurements from VMware tools are queried for 10 seconds once every 30 minutes
Step 2: Compose a configuration file and add custom metric specifications
Metrics:
  CPU:
     description: CPU
     tool: PowershellVMWareScript
     metrictype: host
  Memory:
     description: Memeory
     tool: PowershellVMWareScript
     metrictype: host

Tools:
  PowershellVMWareScript
    command: VDMeasurement.exe –m cpu –m mem
    runat: <SRC>
    dbtable:
          - field: [cpuDt,HostAddress, CPU]
            type:  [timestamp, varchar(25), varchar(25), double]
          - field: [memDt,HostAddress, MEM]
            type:  [timestamp, varchar(25), varchar(25), double]
    graphite:
         - send: [CPU,HostAddress.CPU]
         - send: [MEM,HostAddress.MEM]
    time: 30
    duration: 10
    conflict: []
Step 3: Add custom metric configuration file and parser file into OnTimeMeasure framework
From Researcher Web-portal (OnTimeBeacon):
Login to http://ontime.oar.net. In "Request Specification" page, select the configuration file/parser file and click the "Add Metric" button.
Or, From Command-line (OnTimeControl):
Invoke python add_metric.py –c CPUMEM.yaml -p CPUMEM.pm
The custom metrics for the VDC GENI experiment are now integrated into OnTimeMeasure!
Attachments (7)
- custom-metric-concept.png (25.2 KB) - added by 12 years ago.
- custom-metric-integrations.png (119.5 KB) - added by 12 years ago.
- custom-metric-query.png (139.7 KB) - added by 12 years ago.
- custom-metric-specification.png (179.9 KB) - added by 12 years ago.
- purdue-expt-setup.png (75.8 KB) - added by 12 years ago.
- add-custom-metric.png (134.5 KB) - added by 12 years ago.
- FrameLengthParser.pm (362 bytes) - added by 12 years ago.
Download all attachments as: .zip