
| Version 40 (modified by , 13 years ago) (diff) |
|---|
-
LAMP I&M System: Tutorial
- Getting Ready
-
Quick Start
- Before we start: a few words on the LAMP I&M System design
- 1. Modify the RSpec
- 2. Create and start our slice
- 3. Upload your experiment's topology to UNIS
- 4. Request and setup the LAMP certificate
- 5. Accessing the LAMP Portal
- 6. Enabling/Disabling Services
- 7. Configuring NTP servers (optional)
- 8. Scheduling Latency and Bandwidth Tests
- 9. Pushing our Changes to UNIS
- 10. Reaping the Benefits
LAMP I&M System: Tutorial
Welcome to the LAMP Instrumentation & Measurement (I&M) System tutorial. This tutorial will take you through the steps in creating a ProtoGENI slice with Instrumentation & Measurement (I&M) capabilities based on the perfSONAR framework and the perfSONAR-PS software suite. This tutorial and the full documentation for the LAMP I&M System is still under development, but we have made a Quick Start Guide to get you started right away. Please feel free to contact us with questions or any type of feedback at lamp@damsl.cis.udel.edu.
Getting Ready
The LAMP I&M System is currently tailored to characteristics of the ProtoGENI Control Framework. The LAMP I&M System is also limited to the UBUNTU91-LAMP disk image that can be found on Utah's (Emulab.net) ProtoGENI testbed. We intend to create software packages and instructions for customizing existing or new images with the LAMP software. In the meantime, the following steps must be taken prior to testing our system:
- Get a ProtoGENI account and familiarize yourself with using ProtoGENI. The ProtoGENI tutorial is a great resource for this. Make sure you follow the instructions to get your SSH Keys set up.
- Download the ProtoGENI test scripts. We will use these to create and start our slice.
- Download the following LAMP scripts: lamp-getcertificate.py and lamp-sendmanifest.py. These scripts will be used to help setup your LAMP-enabled slice. The scripts will look in their local directory for the test-common.py script included in ProtoGENI's test scripts bundle.
Quick Start
This section will guide you through creating and starting a slice, requesting a LAMP services certificate for your slice, uploading your experiment's topology to UNIS, and setting up the instrumentation and measurement facilities of your slice. The expected time required to setup your slice with the LAMP I&M System is around 10 minutes. Following this guide through the end is aimed to take 45 to 60 minutes. Let us know how long it takes you and places for improvement!
Before we start: a few words on the LAMP I&M System design
It is useful to understand the general principles behind the steps we will take throughout this tutorial. The LAMP I&M System is built on top of three pillars:
- LAMP Portal: The LAMP Portal is the goto resource for experimenters to manage and visualize their I&M services and data. The portal is deployed with the LAMP image and will usually be enabled through the initial RSpec configuration for the experiment. The portal can run on any node or (nodes) within the slice. The LAMP Portal is derived from the Web Admin component of the pS-Performance Toolkit 3.2 RC1 (although not required, looking at the comprehensive Quick Start guide of the pS Toolkit can be very useful to understand the LAMP I&M System setup).
- UNIS and Topology-based Configuration: The Unified Network Information Service (UNIS) is the most important component of the LAMP architecture. For those familiar with perfSONAR, this service is the combination of the Lookup Service and the Topology Service of the perfSONAR framework. We use UNIS to store the topology data of our slice, and services register themselves so that they can be found dynamically. The configuration of the LAMP services is done through annotations on the topology data. Through the LAMP Portal we configure our services and upload the modified topology to UNIS. The configuration pushed to UNIS is then fetched by the perfSONAR-PS pSConfig service that runs on each node. The pSConfig service will parse the configuration for the node and make all necessary changes.
- I&M software (measurement tools and perfSONAR services): The LAMP I&M System wouldn't be possible without leveraging the existing measurement tools and the mature perfSONAR-PS software suite. The LAMP I&M System derives directly from pS-Performance Toolkit and the perfSONAR-PS services. See the web page for the perfSONAR-PS project for more information.
All the services on the LAMP I&M System have Authentication and Authorization (AA) capabilities based on the ProtoGENI AA model. See our AA page for more information.
1. Modify the RSpec
There's only one thing that must be done to have LAMP I&M on your slice: specify the LAMP disk image to be loaded on each node that needs I&M. The URN for the LAMP disk image is urn:publicid:IDN+emulab.net+image+GeniSlices//UBUNTU91-LAMP. See the RSpec Disk Image Example and our tutorial RSpec below for how to specify the disk image to be used on a node.
Nodes booting the LAMP disk image will have all the LAMP services available, but only the topology-based configuration service (pSConfig) will be running by default. This isn't very useful for the experimenter as not even the LAMP Portal will be accessible (remember that you have to specify in which node(s) the portal will be enabled). To make the process simpler to the user, an initial configuration for the slice can be specified on a LAMP extension to the RSpec. Let's see our tutorial's RSpec and go through the different elements to understand how this configuration can be specified. For this Quick Start guide we will use a very simple topology: two nodes will be connected through a link with 100ms latency and 0.05 loss, and a third node with no interfaces (only the control plane interface) will lodge the LAMP Portal (and eventually store host monitoring data). This is our RSpec:
<rspec xmlns="http://protogeni.net/resources/rspec/0.2"
   xmlns:lamp="http://protogeni.net/resources/rspec/0.2/ext/lamp/1">

   <node virtual_id="node1" virtualization_type="raw" exclusive="1"
      startup_command="/usr/local/etc/lamp/bootstrap.sh urn:publicid:IDN+emulab.net+slice+lamptutorial urn:publicid:IDN+emulab.net+user+fernande">

      <node_type type_name="pc" type_slots="1"/>

      <disk_image name="urn:publicid:IDN+emulab.net+image+GeniSlices//UBUNTU91-LAMP" />

      <lamp:config />

      <interface virtual_id="iface0"/>
   </node>

   <node virtual_id="node2" virtualization_type="raw" exclusive="1"
      startup_command="/usr/local/etc/lamp/bootstrap.sh urn:publicid:IDN+emulab.net+slice+lamptutorial urn:publicid:IDN+emulab.net+user+fernande">

      <node_type type_name="pc" type_slots="1"/>
      <disk_image name="urn:publicid:IDN+emulab.net+image+GeniSlices//UBUNTU91-LAMP" />
      <lamp:config />
      <interface virtual_id="iface0"/>
   </node>

   <link virtual_id="link1" >
      <interface_ref virtual_node_id="node1" virtual_interface_id="iface0"/>
      <interface_ref virtual_node_id="node2" virtual_interface_id="iface0"/>
      <link_type type_name="ethernet" />
      <latency>100</latency>
      <packet_loss>0.05</packet_loss>
   </link>

   <node virtual_id="lamp" virtualization_type="raw" exclusive="1"
      startup_command="/usr/local/etc/lamp/bootstrap.sh urn:publicid:IDN+emulab.net+slice+lamptutorial urn:publicid:IDN+emulab.net+user+fernande">

      <node_type type_name="pc" type_slots="1"/>
      <disk_image name="urn:publicid:IDN+emulab.net+image+GeniSlices//UBUNTU91-LAMP" />

      <lamp:config>
         <lamp:service type="lamp_portal" enable="true" />
      </lamp:config>

   </node>
</rspec>
We can see on the above RSpec three LAMP-specific elements: the startup_command for running the bootstrapping script, the disk image element with the LAMP image, and the <lamp:config> extension (note the XML namespace for this extension at the top). The startup_command will run a shell script that sets up a few basic variables describing the node so that the LAMP services know where they're running. Services will not be able to run without these variables set. The usage for this script is as follows.
/usr/local/etc/lamp/bootstrap.sh <slice_urn> <user_urn>
Bootstrapping only needs to be done once, but the script is idempotent and can thus be run through the startup_command directive of the ProtoGENI CF. Alternatively, you can also run this command manually on the nodes and restart the configuration service (more on this later).
The next LAMP-specific element in our RSpec, the disk_image directive, has already been discussed above. Finally, the <lamp:config /> extension lets us specify the initial configuration for our nodes. For example, looking at the lamp node in the RSpec, we see that we have specified that the lamp_portal service should be enabled. This extension, however, also specifies which nodes can be configured through the LAMP Portal (and topology annotations). This is why we have the empty config element <lamp:config /> on the node1 and node2 nodes. In other words, the lamp node will be our host for accessing the LAMP Portal, wherein we can configure all three nodes of our slice.
Other services can be enabled using the same mechanism, but on this quick start guide we will only cover enabling and configuring services through the LAMP Portal (who wants to read and write XML after all? :).
2. Create and start our slice
After modifying the RSpec as explained on the previous step, we proceed to create the slice/sliver as usual. Please refer to the ProtoGENI tutorial if you're not familiar with the following commands.
$ test/createsliver.py -n lamptutorial rspec/examples/lamp-tutorial-rspec.xml
Got my SA credential
Asking for slice credential for lamptutorial
Got the slice credential
Creating the Sliver ...
Created the sliver
<rspec xmlns="http://protogeni.net/resources/rspec/0.2" xmlns:lamp="http://protogeni.net/resources/rspec/0.2/ext/lamp/1" valid_until="2010-09-22T03:34:50">

   <node virtual_id="node1" virtualization_type="raw" exclusive="1" startup_command="/usr/local/etc/lamp/bootstrap.sh urn:publicid:IDN+emulab.net+slice+lamptutorial urn:publicid:IDN+emulab.net+user+fernande" component_urn="urn:publicid:IDN+emulab.net+node+pc123" component_uuid="de98e5e4-773e-102b-8eb4-001143e453fe" component_manager_urn="urn:publicid:IDN+emulab.net+authority+cm" component_manager_uuid="28a10955-aa00-11dd-ad1f-001143e453fe" sliver_uuid="de98e5e4-773e-102b-8eb4-001143e453fe" hostname="pc123.emulab.net" sshdport="22" sliver_urn="urn:publicid:IDN+emulab.net+sliver+20386">

      <node_type type_name="pc" type_slots="1"/>

      <disk_image name="urn:publicid:IDN+emulab.net+image+GeniSlices//UBUNTU91-LAMP"/>

      <lamp:config/>

      <interface virtual_id="iface0" component_id="eth3"/>
   <services><login authentication="ssh-keys" hostname="pc123.emulab.net" port="22"/></services></node>

... rest of manifest ...
</rspec>
You can see the full manifest returned for this particular instance here. Save (copy/paste) this manifest to a file, we will call it lamptutorial-manifest.xml.
At this point it is important to notice the valid_until field of the manifest: valid_until="2010-09-22T03:34:50". If you feel like this is not enough time for your slice, use the renewsliver.py test script to extend your slice. You should do this now as step 4 depends on this (actually, it depends on the expiration time of the slice, which seems to be a couple of hours more than what's in the manifest). While our slice is being started we can go ahead and setup the LAMP infrastructure for our experiment.
3. Upload your experiment's topology to UNIS
UNIS is the glue that holds the LAMP I&M System together (see the Before we start section above). Services are configured (and configure themselves) through the topology data and the directory of services in UNIS. The first step we need to take before being able to configure and utilize our LAMP services is to convert our experiment's manifest into the UNIS topology schema and send it to UNIS. This is done automatically by the script lamp-sendmanifest.py. The usage for the lamp-sendmanifest.py script is as follows.
$ test/lamp-sendmanifest.py
Not enough arguments
Usage: <manifest> <slice_urn> [credential]
Where <manifest> is the file we saved our manifest to; <slice_urn> is the fully-qualified URN of our slice (urn:publicid:IDN+emulab.net+slice+lamptutorial); and [credential] is a file with our credential for the slice. The credential parameter is optional if you use the LAMP certificate for your slice (see step 4). We could have done step 4 first and used the LAMP certificate for this step, but we want to show that UNIS can be accessed with your own certificate and the slice credential. So we will go ahead and get our slice credential first:
$ test/getslicecredential.py -n lamptutorial > lamptutorial-credential.xml
A small modification needs to be done for now on the credential we just saved: we must remove the first line that indicates the xml version and encoding. Make sure you do not modify any other line, otherwise the signature check will fail. Our credential is now ready to be used with the lamp-sendmanifest.py script.
$ test/lamp-sendmanifest.py lamptutorial-manifest.xml urn:publicid:IDN+emulab.net+slice+lamptutorial lamptutorial-credential.xml

<nmwg:message type="TSReplaceRequest" xmlns:nmwg="http://ggf.org/ns/nmwg/base/2.0/">
  <nmwg:metadata id="meta0">

    <nmwg:eventType>http://ggf.org/ns/nmwg/topology/20070809</nmwg:eventType>
  </nmwg:metadata>

  <nmwg:metadata id="cred0">
    <nmwg:subject metadataIdRef="meta0">
<signed-credential xmlns:xsi="http://www.w3.org/2001/XMLSchema-instance" xsi:noNamespaceSchemaLocation="http://www.protogeni.net/resources/credential/credential.xsd" xsi:schemaLocation="http://www.protogeni.net/resources/credential/ext/policy/1 http://www.protogeni.net/resources/credential/ext/policy/1/policy.xsd">
  <credential xml:id="ref1CC6F2904F4CCCFA">

  ... rest of credential ...
</signed-credential>


    </nmwg:subject>
    <nmwg:eventType>http://perfsonar.net/ns/protogeni/auth/credential/1</nmwg:eventType>
  </nmwg:metadata>

  <nmwg:data id="data0" metadataIdRef="cred0">
<topology id="genitopo" xmlns="http://ogf.org/schema/network/topology/unis/20100528/" xmlns:pgeni="http://ogf.org/schema/network/topology/protogeni/20100716/" xmlns:psconfig="http://ogf.org/schema/network/topology/psconfig/20100716/">
	<domain id="urn:ogf:network:domain=emulab.net+slice+lamptutorial">
		<node id="urn:ogf:network:domain=emulab.net+slice+lamptutorial:node=node1">
			<address type="dns">
				pc123.emulab.net
			</address>
			<nodePropertiesBag>
				<pgeni:nodeProperties component_manager_urn="urn:publicid:IDN+emulab.net+authority+cm" component_manager_uuid="28a10955-aa00-11dd-ad1f-001143e453fe" component_urn="urn:publicid:IDN+emulab.net+node+pc123" component_uuid="de98e5e4-773e-102b-8eb4-001143e453fe" exclusive="1" sliver_urn="urn:publicid:IDN+emulab.net+sliver+20386" sliver_uuid="de98e5e4-773e-102b-8eb4-001143e453fe" startup_command="/usr/local/etc/lamp/bootstrap.sh urn:publicid:IDN+emulab.net+slice+lamptutorial urn:publicid:IDN+emulab.net+user+fernande" virtualization_type="raw">
					<pgeni:node_type type_name="pc" type_slots="1"/>
					<pgeni:disk_image name="urn:publicid:IDN+emulab.net+image+GeniSlices//UBUNTU91-LAMP"/>
					<pgeni:services>
						<pgeni:login authentication="ssh-keys" hostname="pc123.emulab.net" port="22"/>
					</pgeni:services>
				</pgeni:nodeProperties>
				<psconfig:nodeProperties/>
			</nodePropertiesBag>
			<port id="urn:ogf:network:domain=emulab.net+slice+lamptutorial:node=node1:port=iface0">
				<name>
					eth3
				</name>
				<portPropertiesBag>
					<pgeni:portProperties component_id="eth3" component_urn="urn:publicid:IDN+emulab.net+interface+pc123:eth3" sliver_urn="urn:publicid:IDN+emulab.net+sliver+20390" sliver_uuid="012ff9dc-c5b0-11df-ad83-001143e453fe"/>
				</portPropertiesBag>
				<address type="mac">
					0002b365ce6b
				</address>
				<address type="ipv4">
					10.10.1.1
				</address>
			</port>
		</node>

                ... rest of slice topology in UNIS schema ...
	</domain>
</topology>

  </nmwg:data>
</nmwg:message>


Enter PEM pass phrase:
The first message that appears is the message we send to UNIS. We won't go over the details of this message right now, other to point out that we are sending a TSReplaceRequest, passing the credential and our slice's topology in UNIS format. Since all LAMP services are SSL enabled (see our AA page for more), we need to use our ProtoGENI certificate for the request (the script will use the $HOME/.ssl/encrypted.pem path by default, you can change this by specifying the environment variables HTTPS_CERT_FILE and HTTPS_KEY_FILE). If the certificate is password protected, the prompt "Enter PEM pass phrase:" shown above will appear. Enter you certificate's password for the script to continue. The script will send the topology replace request and output the result message:
Received:

<SOAP-ENV:Envelope xmlns:SOAP-ENC="http://schemas.xmlsoap.org/soap/encoding/"
                   xmlns:xsd="http://www.w3.org/2001/XMLSchema"
                   xmlns:xsi="http://www.w3.org/2001/XMLSchema-instance"
                   xmlns:SOAP-ENV="http://schemas.xmlsoap.org/soap/envelope/">
  <SOAP-ENV:Header/>
  <SOAP-ENV:Body>
<nmwg:message xmlns:nmwg="http://ggf.org/ns/nmwg/base/2.0/" id="message.1791117" type="TSReplaceResponse"><nmwg:metadata metadataIdRef="meta0" id="metadata.6705932"><nmwg:eventType>success.ma.replaced</nmwg:eventType></nmwg:metadata><nmwg:data metadataIdRef="metadata.6705932" id="data.17724448"><nmwgr:datum xmlns:nmwgr="http://ggf.org/ns/nmwg/result/2.0/">data element(s) successfully replaced</nmwgr:datum></nmwg:data><nmwg:metadata xmlns:nmwg="http://ggf.org/ns/nmwg/base/2.0/" id="meta0">

    <nmwg:eventType>http://ggf.org/ns/nmwg/topology/20070809</nmwg:eventType>
  </nmwg:metadata></nmwg:message>  </SOAP-ENV:Body>
</SOAP-ENV:Envelope>
This is a standard perfSONAR exchange. We send a NMWG request and get back a response with an eventType and possibly a response message. In this case the eventType is "success.ma.replaced" and the message "data element(s) successfully replaced". Great! Everything worked. Our topology is now in UNIS and our services can request it to learn more about the network and their own configuration. If this step fails for you, check that your credential is valid, that you're using the right certificate for the credential, and that you gave the correct slice URN. Contact us at lamp@damsl.cis.udel.edu if the problems persist.
4. Request and setup the LAMP certificate
Right now our topology is on UNIS and our slice has started/is starting. Because of security considerations, only those with a valid slice credential can access the slice's topology information in UNIS. However, LAMP services rely on that information to configure themselves (and sometimes also need to communicate with each other). This requires LAMP services to have access to a special certificate that grants them the necessary permissions. Right now the only way we have to provide this is to give users a slice specific certificate that lasts until the slice's expiration time (given in the slice credential). Users can request this certificate with the lamp-getcertificate.py script. This script works similarly to the ProtoGENI test scripts and requires only the name of the slice as an argument.
If you get a hostname mismatch error (Peer certificate subjectAltName does not match host, expected ...) during this step, please update your M2Crypto library to the newest version.
fernandes@debian:~/dev/geni$ test/lamp-getcertificate.py -n lamptutorial
Got my SA credential, looking up lamptutorial
Asking for slice credential for lamptutorial
Got the slice credential
Asking for my lamp certificate
Paste the following certificate *as is* into a file called lampcert.pem
Upload the certificate to all LAMP enabled nodes at /usr/local/etc/protogeni/ssl/lampcert.pem
-----BEGIN RSA PRIVATE KEY-----
... certificate's private key ...
-----END RSA PRIVATE KEY-----
Certificate:
    Data:
        ... certificate's data ...

            X509v3 Subject Alternative Name:
                URI:urn:publicid:IDN+emulab.net+service+lamp@lamptutorial
        ...

-----BEGIN CERTIFICATE-----
... certificate ...
-----END CERTIFICATE-----
Following the instructions shown by the script, we copy paste the certificate with the private key into a file, say lamptutorial-cert.pem (you can call it anything you want locally, but it must be called lampcert.pem at the nodes). This file will then need to be uploaded to each of the nodes that have LAMP services at the indicated location: /usr/local/etc/protogeni/ssl/lampcert.pem. (Sorry for the work this causes right now, we will try to streamline it in the future.) Note that the certificate file cannot be password protected because services will use it without user intervention.
To upload the certificate to all the nodes we can use the following Unix commands. Feel free to do it in your preferred way.
Get the list of hostnames in our slice (you might need manually check if some nodes are not LAMP related):
$ grep "login" lamptutorial-manifest.xml
   <services><login authentication="ssh-keys" hostname="pc123.emulab.net" port="22"/></services></node>
   <services><login authentication="ssh-keys" hostname="pc112.emulab.net" port="22"/></services></node>
   <services><login authentication="ssh-keys" hostname="pc99.emulab.net" port="22"/></services></node>
Use bash scripting to upload the certificate, move it to the right place, set the correct permissions and owner/group, and finally restart pSConfig:
$ for node in pc123.emulab.net pc112.emulab.net pc99.emulab.net; do
>      scp lamptutorial-cert.pem fernande@$node:
>      ssh fernande@$node "sudo mv lamptutorial-cert.pem /usr/local/etc/protogeni/ssl/lampcert.pem"
>      ssh fernande@$node "sudo chown root.perfsonar /usr/local/etc/protogeni/ssl/lampcert.pem"
>      ssh fernande@$node "sudo chmod 440 /usr/local/etc/protogeni/ssl/lampcert.pem"
>      ssh fernande@$node "sudo /etc/init.d/psconfig restart"
> done
Note that services run under the perfsonar user, and the httpd server will read the certificate as root. The last step is to (re)start pSConfig, the service that fetches and configures the nodes according to the topology information. If you did not setup the RSpec to run the bootstrap.sh script on startup, you will need to run it on all nodes before starting pSConfig (e.g. I would add ssh fernande@$node "sudo /usr/local/etc/lamp/bootstrap.sh urn:publicid:IDN+emulab.net+slice+lamptutorial urn:publicid:IDN+emulab.net+user+fernande" before the last line on the above command, while you would need to change the slice and user URNs).
5. Accessing the LAMP Portal
We have now uploaded our slice's topology to UNIS and we have setup our nodes with the LAMP certificate (and bootstrapped the configuration). As soon as pSConfig starts, the service will contact UNIS and fetch the configuration for the node. On our tutorial's RSpec, only one service is enabled for now: the LAMP Portal on the lamp node. pSConfig will thus enable the service automatically. It can take up to 5 minutes for services to start/stop based on configuration changes (a service watcher script runs every 5 minutes and will make sure that any enabled/disabled services are running/stopped).
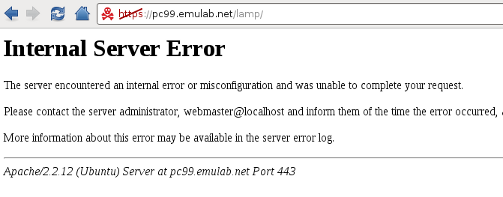
After a few minutes we try to access the LAMP Portal at our lamp node: https://pc99.emulab.net/lamp/. To our surprise, however, we get an error:
 certificate.")
(We're sorry that right now our error reporting is so uninformative, the user doesn't really know what happened.) Looking at the error log for the web server (/var/log/apache2/error.log) we see the following error message:
[Tue Sep 21 16:44:17 2010] [error] [client 128.4.62.115] You're not authorized to access this service. at /opt/perfsonar_ps/perfSONAR_PS-Toolkit/web/root/gui/services/../../../../lib/perfSONAR_PS/Utils/GENIPolicy.pm line 91.
Ah, so everything makes sense now. We either did not use a certificate to access the server, or used a certificate for a user that is not allowed to access the service. Currently in our slice, only us (the slice owner) will be able to access the LAMP Portal with their ProtoGENI certificate, but also anyone using the LAMP certificate (remember, LAMP services trust the LAMP certificate implicitly! so be carefully with it). To setup your browser to use a certificate, if you haven't done so already, follow the instructions at ProtoGENI Flash Client Setup. You'll have to look for similar instructions for other browsers (e.g. for Google Chromium).
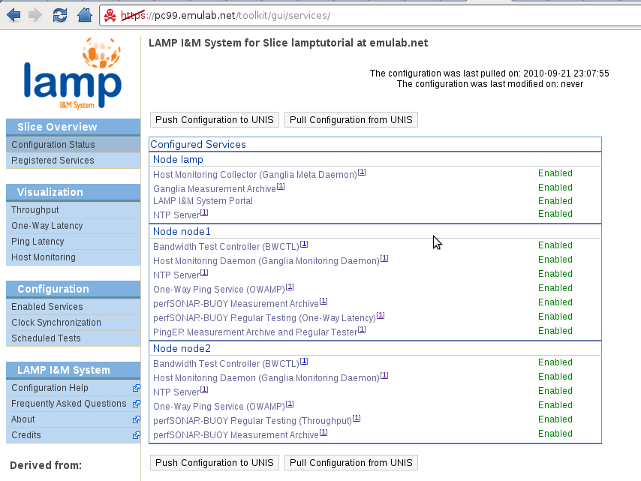
After setting up our certificate on the browser we can finally access the LAMP Portal.

The first time the LAMP Portal is opened it will query UNIS and retrieve the set of configurable nodes and their current configuration. The home page that we're seeing on the above image is the Configuration Status page on the left sidebar. Here we can see all the LAMP nodes on our slice and their current services. We also see the date we last fetched the topology information from UNIS and that we haven't modified it.
6. Enabling/Disabling Services
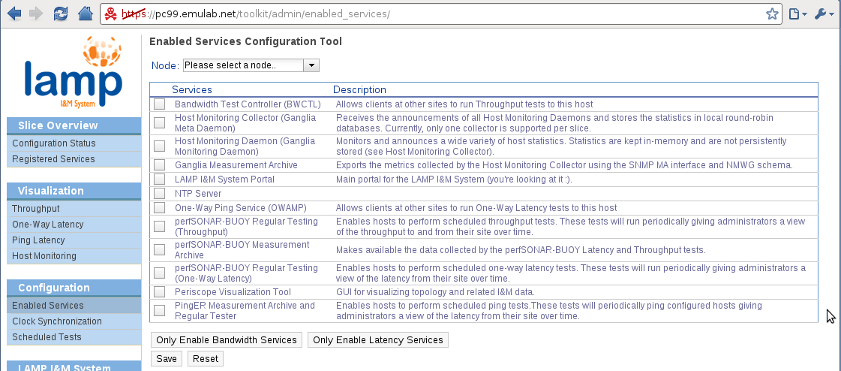
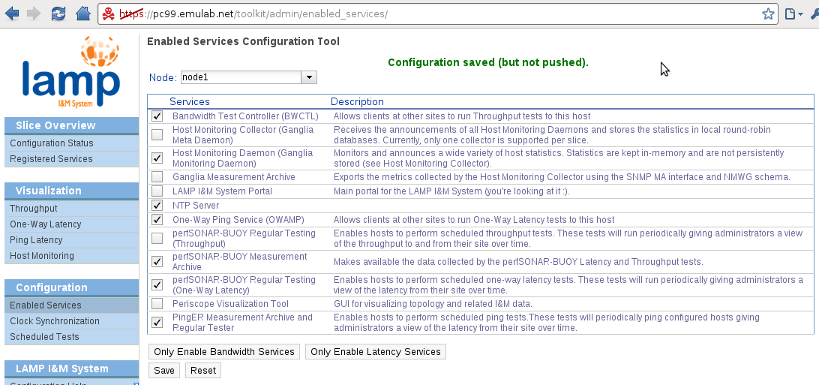
At this moment we can see that no I&M services are running on our slice. To remedy this situation we click on the Enabled Services link under the Configuration menu on the left sidebar.

In this page we see all the services that are available to us. You can read their description for an overview of the functionality they provide, and you can find more information about them on the links on the bottom of the Configuration Status page. We will have the following setup for I&M on our slice:
- node1: Runs the Host Monitoring Daemon, all latency services, BWCTL and the NTP server (note that NTP is a prerequisite for using OWAMP and BWCTL).
- node2: Runs the Host Monitoring Daemon, the bandwidth services, OWAMP and the NTP server.
- lamp: Runs the LAMP Portal, the Host Monitoring Collector, the Ganglia MA, and NTP server.
Our flagship visualization service, Periscope, is not included in the RC1 version of the software, but hopefully it will be included soon.
A couple of things to note. Even if node1 will not be initiating bandwidth tests itself, BWCTL must still be enabled (both endpoints must have BWCTL running for bandwidth tests to work). The same goes for node2 and OWAMP. Enabling the host monitoring collector will automatically run the host monitoring daemon on the node. Because BWCTL and OWAMP require NTP, if any of these two services is enabled NTP will also be started; however, you are only able to configure NTP on nodes that have it explicitly enabled. The data measured by the host monitoring daemons is only stored by the host monitoring collector. The Ganglia MA is actually a SNMP MA that wraps the data store of the host monitoring collector and exports it using the perfSONAR API and schemas.
For each node, after selecting the appropriate services we must click the Save button to save the configuration locally.

After we finish configuring our nodes, we can go back to the Configuration Status page and see the overview of our current configuration state.

We have enabled all the I&M services we want for our slice, but the warning message in red is telling us something. Changes made on the portal are saved locally; the user must explicitly request a push of the local changes to UNIS. This reduces the load on UNIS and prevents starting services that have not been fully configured (i.e. our current state for the latency and bandwidth services).
7. Configuring NTP servers (optional)
This is an optional step. The LAMP image has default configuration for the NTP server. However this might not be the best configuration (i.e. best servers for the nodes to query), or you might prefer to access your preferred NTP servers.
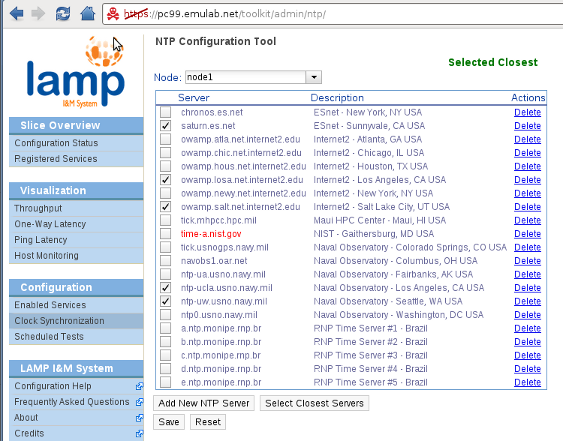
To configure the NTP server on each node we go to the Clock Synchronization configuration page. In this example we will configure node1 by clicking the 'Select Closest Servers' button and letting the portal select the servers for us.

We can see that the configuration tool was unable to contact the time-a.nist.gov server, and has selected 5 of the closest (in terms of latency) servers to our lamp node (the node running the Portal, not the node being configured). We then save the configuration and move on to configure the actual I&M services. (We will leave the default configuration on the nodes lamp and node2.)
For more information on the NTP configuration tool, see the corresponding section on the pS-Performance Toolkit Tutorial.
8. Scheduling Latency and Bandwidth Tests
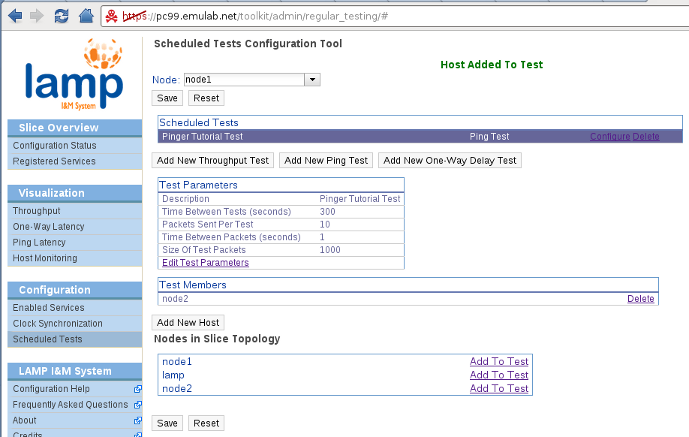
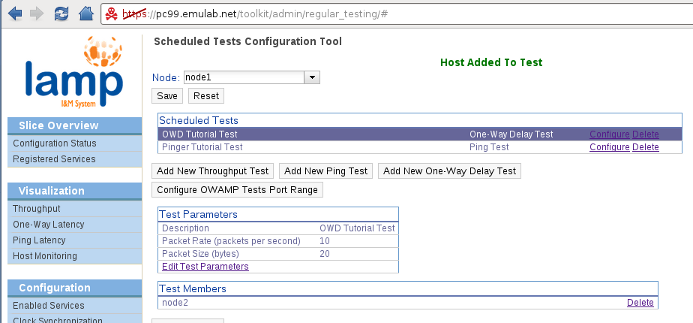
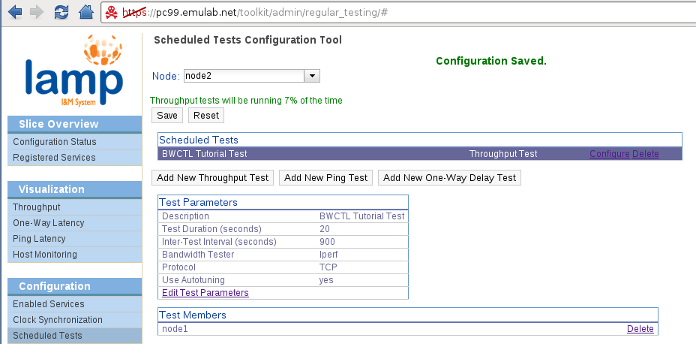
To configure the latency and bandwidth tests we want for our slice we go to the Scheduled Tests configuration page. We will not cover the configuration tool in details in this quick start guide. Please refer to the Scheduled Testing section of the pS-Performance Toolkit Tutorial for a detailed explanation of the configuration tool. We will only cover the modifications done to the interface for LAMP.
The first difference is the ability to select which node we want to configure. These tests are always scheduled in a star configuration, originating from the node where the tests are being configured. However, OWAMP (one-way latency) and BWCTL (throughput) tests will run in both directions (managed by the same node). We will configure the following scheduled tests on our slice:
- node1: Ping test (default parameters) to node2. One-way delay test (default parameters) to node2.
- node2: Throughput test to node1 at 15 minutes interval (all other parameters default). Note that only iperf is currently installed on the LAMP image.
Another change from the pS-Performance Toolkit is that we restrict the hosts that can be selected as targets for the tests to the nodes in the slice topology. We use the localname of each node so that the addresses on the virtual topology will be used for the tests (i.e. tests will not go through the control plane). Because of this we have to emphasize that both endpoints must be running the corresponding daemon (BWCTL for throughput tests and OWAMP for one-way delay tests). In the near future, we intend to filter the possible targets by checking the daemons registered on UNIS (as it is done on the pS-Performance Toolkit, but here restricted to the slice topology). The configuration for each node should look like this:


Make sure you save the configuration on each node before moving on. Do not worry about the 'Resetting configuration' message when selecting another node, it's just loading the configuration for that particular back into the tool (i.e. resetting the configuration for the tool, not the node.. yes, sorry, we should change that message).
9. Pushing our Changes to UNIS
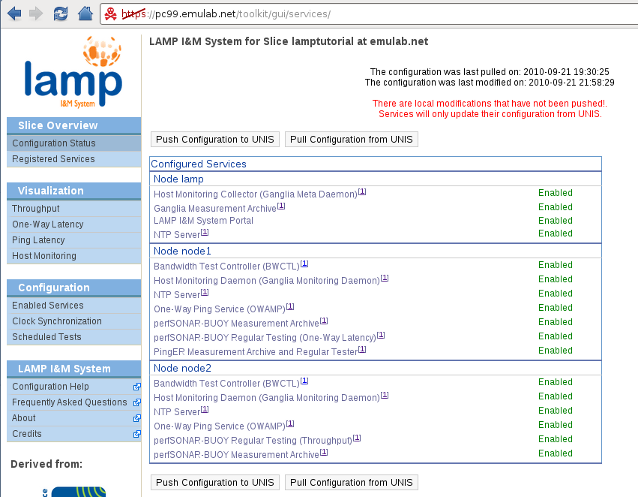
We have now finished the configuration of our I&M services. The host monitoring tool (Ganglia) will be enabled with default parameters (monitor all metrics available by default). The host monitoring daemons will be configured by pSConfig to send their announcements to the host monitoring collector. However, we have only made changes to the configuration stored on our LAMP Portal node. We need to push these changes to UNIS so that the nodes in our slice can fetch it and reconfigure themselves.
To do this we go back to the Configuration Status page. We can now hit the Push Configuration button to transfer our local changes to UNIS. If everything goes well, the page will reload and the last pulled and last modified date will be changed accordingly:

10. Reaping the Benefits
We have finished configuring our slice with instrumentation & measurement! It will take a couple of minutes until everything is configured and stabilized. After taking a dinner break (and, in my case, fixing the NTP bug mentioned above), we come back to our LAMP Portal to check on our services and see the data we've collected so far.
Services Registration on UNIS
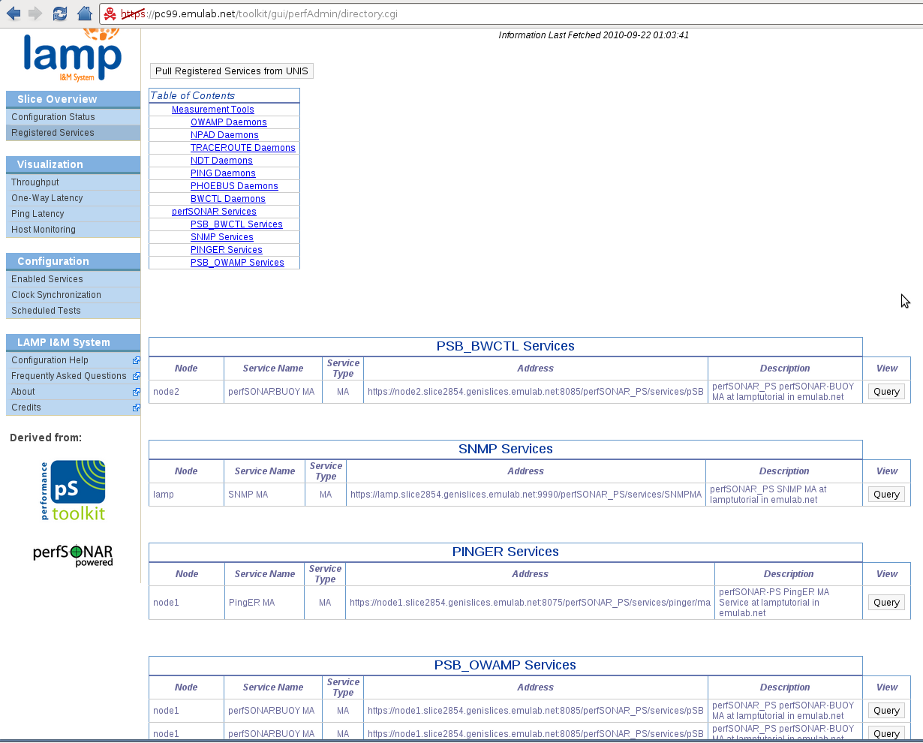
Our services should have started and registered themselves with UNIS. We can check this by going to the Registered Services overview page. (If you don't see any services, click on the Pull Registered Services from UNIS button.)

We can see that all our perfSONAR (measurement) services have registered! The SNMP MA services is the 'Ganglia MA' we configured before; it is a SNMP MA exporting the data collected by the Ganglia Meta Daemon (our host monitoring colletor). Now lets go over the visualization for each type of data.
Visualizing Ping Data
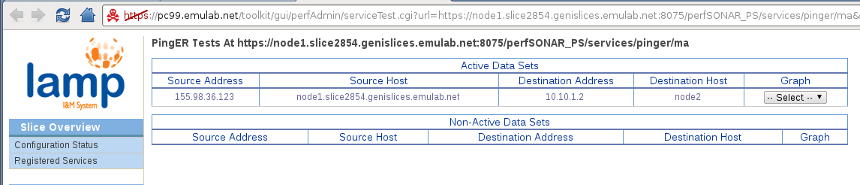
We can see on the left sidebar the four links for visualizing One-way latency, Ping latency, Throughput and Host Monitoring data. However, clicking on these links brings us back to the same page we were on the previous step, the Registered Services page. Right now we do not have a dedicated page for each service/type of data. What we can do is click on the 'Query' button next to the service we want to query. So if we click on the Query button for the PingER MA (3rd row), we should a page similar to the following.

Great! We can see that our dataset exists on the PingER MA. Although the source address appears as the control interface's address (it just reverse resolves the hostname), the tests do go through the virtual topology because the destination address is the address for node2's iface0. We can now select between 12, 24 and 48 hours graphs. We will take the 12 hours graph since we haven't been running that long. A nifty little graph will popup.

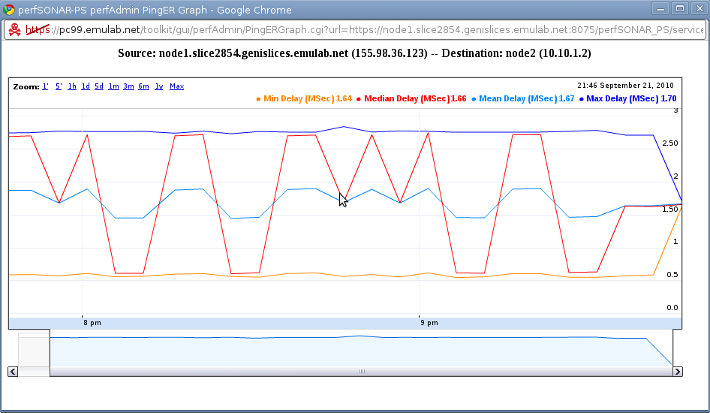
We can see that our Ping latency has been varying from 0.5 to 2.5 ms for the past 2 hours. (Note that the date is time, this is a bug that we will fix soon.) This should, however, raise a red flag! We had asked on our RSpec for a link with 100ms latency. Something is wrong with our slice! (If you do not believe us, run ping manually from node1 to node2, but you can trust us :).
This is one of the reasons instrumentation and measurement is so important. We could be doing our experiments thinking we had one environment and actually be running on one with completely different parameters! But lets move on to the other data we have been collected.
Visualizing Throughput Data
We proceed in the same was as with the PingER MA. You can click on the Throughput visualization link, or go directly to the Registered Services page. We now Query the PSB_BWCTL service on node2.
 dataset metadata page.")
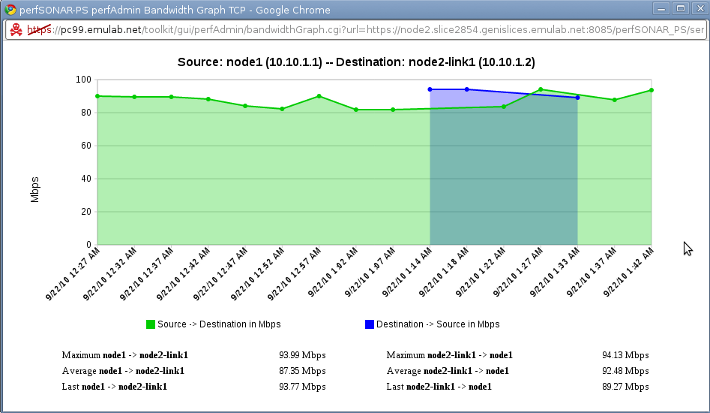
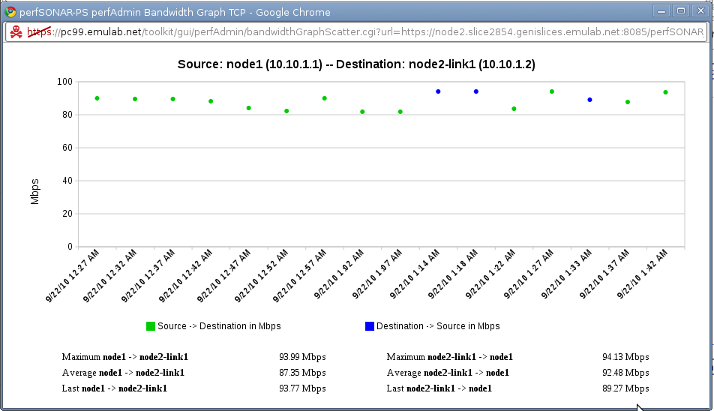
Ah! This looks familiar. We can see our test and its parameters, and we also see a 1 week summary of the bandwidth for our test. We have two options of graphs, the Line Graph and Scatter Graph. Let's see both (1 Day, line and scatter respectively).


That looks good. Seems like ProtoGENI allocated a 100Mb link for our slice. Let's confirm this:
# ethtool eth24
Settings for eth24:
	Supported ports: [ TP MII ]
	Supported link modes:   10baseT/Half 10baseT/Full
	                        100baseT/Half 100baseT/Full
	Supports auto-negotiation: Yes
	Advertised link modes:  Not reported
	Advertised auto-negotiation: No
	Speed: 100Mb/s
...
Yes, seems like we're measuring our link throughput pretty accurately. Let's move on to the one-way latency data.
Visualizing One-way Latency Data
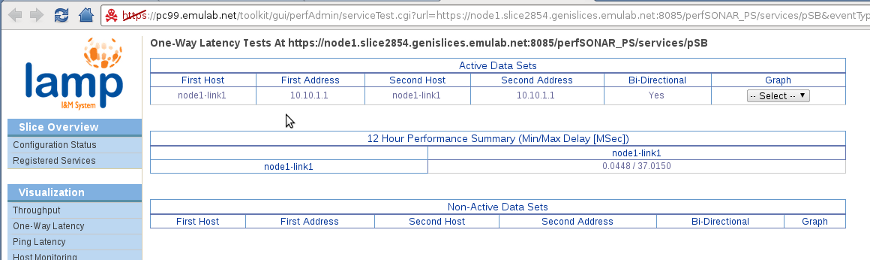
We go back to the Registered Services page and Query the PSB_OWAMP service on node1.
 dataset metadata page.")
Oops! We have found another bug :). perfSONARBUOY seems to only be exporting the data for the one-way delay tests on the loopback interface. All these bugs should be fixed in RC2 and certainly by the final release (expected around October 10).
However, even running a one-way latency test manually shows a couple of problems in our slice.
# owping node2
Approximately 13.1 seconds until results available

--- owping statistics from [node1-link1]:59783 to [node2]:59781 ---
..
100 sent, 0 lost (0.000%), 0 duplicates
one-way delay min/median/max = 8.02/9.1/9.29 ms, (err=4.91 ms)
one-way jitter = 0.1 ms (P95-P50)
...
--- owping statistics from [node2]:45501 to [node1-link1]:33482 ---
...
one-way delay min/median/max = -7.88/-7.8/2.1 ms, (err=4.91 ms)
one-way jitter = 1.1 ms (P95-P50)
Ouch, 5ms error and max of 10ms? We have already seen through our Ping latency tests that the round-trip latency hovers around 2ms; these tests cannot be trusted! Analyzing our node a little bit we can find one of the culprits:
 ntpq -p
     remote           refid      st t when poll reach   delay   offset  jitter
==============================================================================
*ops.emulab.net  198.60.22.240    2 u   16   64   37    0.153   -4.779   2.687
... (other servers that have not peered) ...
We are offset by 5ms from our only NTP synchronization source! This will greatly affect precision measurements on our slice. Many factors can contribute to errors on this type of network measurements; only extensive testing on different slices and hardwares will show if they're appropriate for this environment.
Unfortunately, nothing to see here, let's move on to the Host Monitoring data.
Visualizing Host Monitoring Data
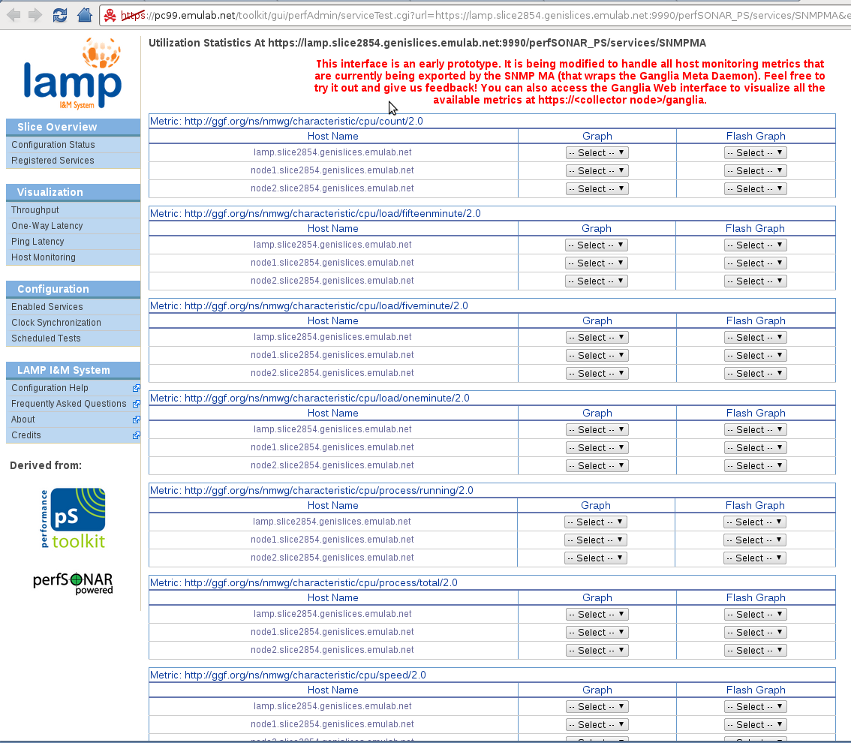
We have saved the best for last (or maybe you like networking like we do). There are two ways of accessing the host monitoring data that we've collected on our nodes. One is by querying the SNMP MA that exports the data with the perfSONAR format. The other is to go to the Ganglia Web interface on our host monitoring collector node (in this example it runs on the same node as the LAMP Portal). Let's first try the SNMP MA. We go to the now familiar Registered Services page (or click on the Host Monitoring link on the side bar, which takes us there), and Query the SNMP Service running on the lamp node.

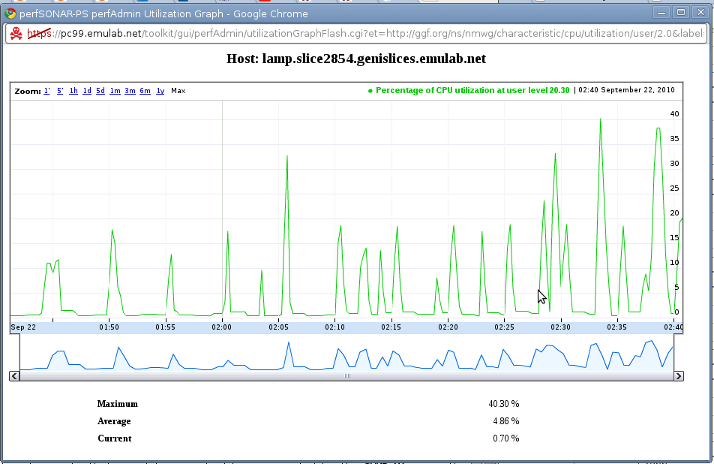
We have been greeted with a large, red "proceed at your own risk" warning :). The corresponding interface on the pS-Performance Toolkit only queried the network utilization (bytes/sec) eventType on the SNMP MA. We are extending this interface to query all of the host monitoring metrics collected by Ganglia. This is still an early prototype, but should be functional (we are keen on receiving bug reports!). Let's pick a node (lamp) and a random metric, say the percentage of CPU utilization while running at user level (http://ggf.org/ns/nmwg/characteristic/cpu/utilization/user/2.0), and open its Flash Graph. Note that you can read a description for the eventType by rest the mouse on top of it.

(Note that this graph shows how much load the LAMP Portal and Visualization tools can incur on the node. This is why we recommend using a dedicated node for these services; the LAMP Portal and the host monitoring collector.)
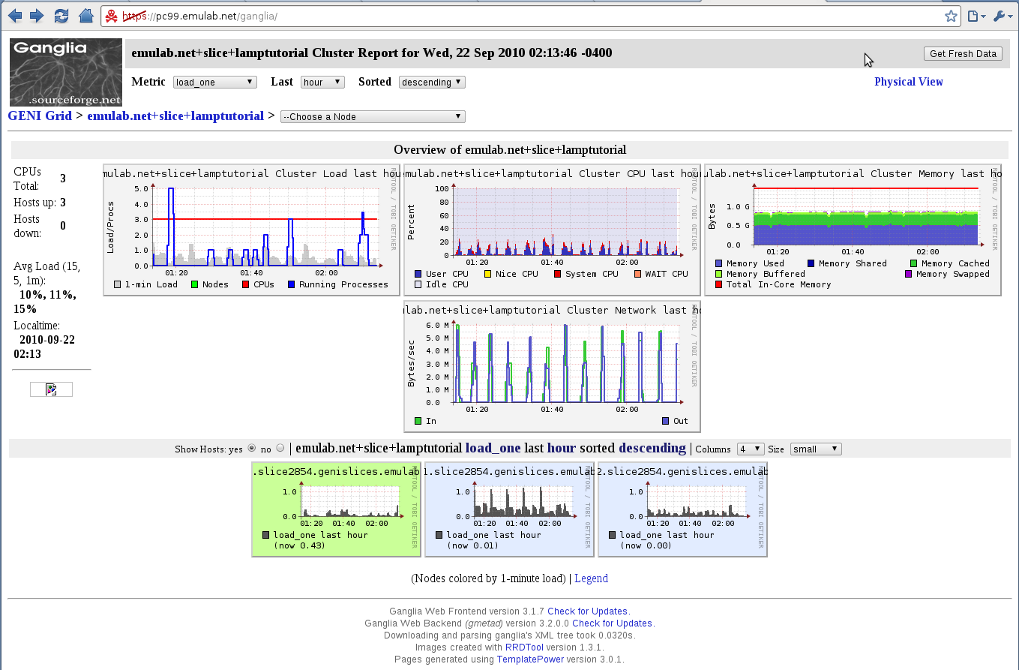
Great! We're able to access the data collected by Ganglia through the SNMP MA using the perfSONAR schema and API. (Feel free to try other metrics!) However, the Ganglia Web visualization tool shows all the hosts monitoring metrics collected with a comprehensive and robust interface. Thus, for host monitoring in specific, we suggest this tool for visualizing the instrumentation on the slice. We can access the Ganglia Web through the URL https://<collector node>/ganglia/.

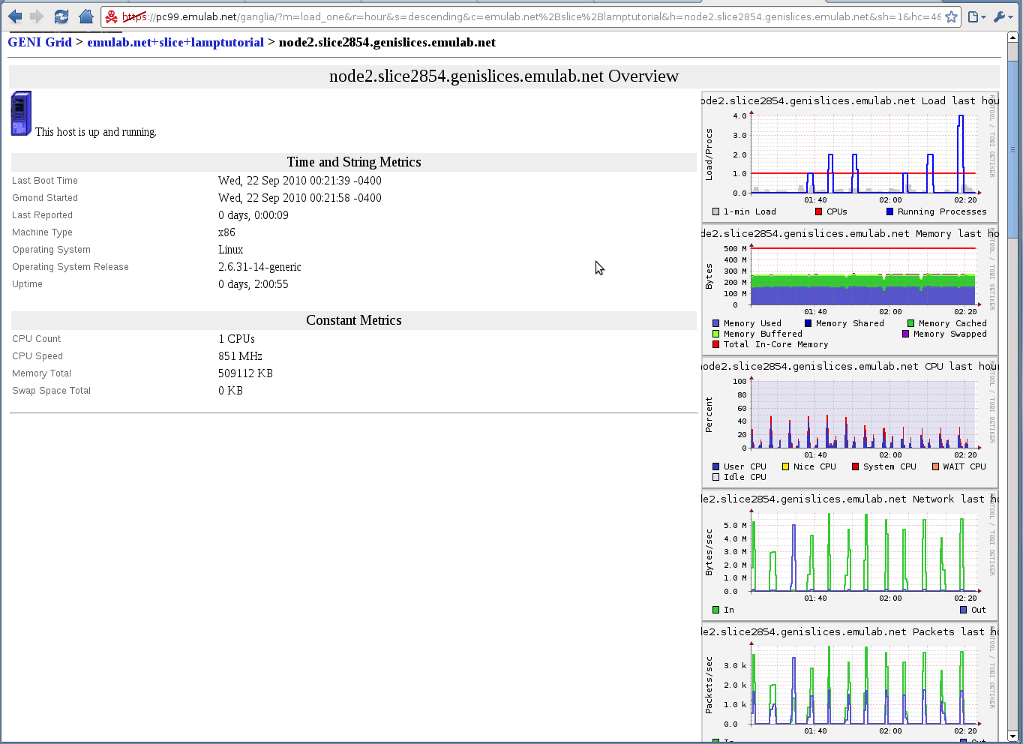
On the front page we have a summary of our "cluster", in our case the whole slice. We can select a node from the dropdown box to see all the metrics we're collecting on each node. Let's select node2.

We can see clear periodic spikes on CPU load and network traffic. These spikes most likely correspond to our scheduled Throughput tests. Note that the network traffic graph shows only 5MB/s, even though we were getting 90Mb/s on the BWCTL tests. The reason for this is that our tests last only for 20 seconds, and these metrics are 5 minutes averages of the network traffic.
And that concludes our Quick Start tutorial! Thank you for spending the time to go through this tutorial. We hope it will be useful for you future experiments!
Please send any questions and feedback to lamp@damsl.cis.udel.edu.
Attachments (26)
-
lamptutorial-manifest.xml (3.7 KB) - added by 14 years ago.
An example manifest for the slice of the tutorial.
-
lamptutorial-credential.xml (5.9 KB) - added by 14 years ago.
Credential example for the LAMP tutorial slice.
-
lamp-getcertificate.py (2.0 KB) - added by 14 years ago.
Script that allows users to get a certificate for their LAMP services.
-
portal-error.png (34.0 KB) - added by 14 years ago.
Error accessing LAMP Portal without a (or proper) certificate.
-
portal1.png (96.1 KB) - added by 14 years ago.
LAMP Portal - slice overview after initial setup.
-
portal2.png (154.7 KB) - added by 14 years ago.
LAMP Portal - Enabled Services configuration page.
-
portal5.png (139.6 KB) - added by 14 years ago.
LAMP Portal - NTP configuration of node1.
-
node1-pinger.png (90.0 KB) - added by 14 years ago.
LAMP Portal - Scheduled test for ping on node1.
-
node1-owd.png (66.1 KB) - added by 14 years ago.
LAMP Portal - Scheduled test for one-way delay on node1.
-
node2-bwctl.png (69.4 KB) - added by 14 years ago.
LAMP Portal - Scheduled test for throughput on node2.
-
portal4.png (129.4 KB) - added by 14 years ago.
LAMP Portal - Overview of configuration after services have been enabled
-
portal3.png (132.9 KB) - added by 14 years ago.
LAMP Portal - Enabling services on node1.
-
portal7.png (177.3 KB) - added by 14 years ago.
LAMP Portal - Registered Services directory.
-
pingerma.png (58.8 KB) - added by 14 years ago.
LAMP Portal - Visualizing PingER MA metadata
-
pingerma-graph.png (68.7 KB) - added by 14 years ago.
LAMP Portal - PingER MA data retrieved as a graph.
-
psb_owamp.png (64.3 KB) - added by 14 years ago.
LAMP Portal - perfSONARBUOY MA (One-way Latency) dataset metadata page.
-
bwctl-line.png (74.5 KB) - added by 14 years ago.
LAMP Portal - Throughput data from perfSONARBUOY as line graph.
-
bwctl-scatter.png (54.6 KB) - added by 14 years ago.
LAMP Portal - Throughput data from perfSONARBUOY as scatter graph.
-
ganglia-web.png (232.1 KB) - added by 14 years ago.
Ganglia Web visualization tool for host monitoring data.
-
ganglia-node2.png (175.0 KB) - added by 14 years ago.
Ganglia Web visualization tool showing data for node2.
-
cpu-utilization.png (75.5 KB) - added by 14 years ago.
Percentage of CPU Utilization at user level for 'lamp' node.
-
portal6.png (123.3 KB) - added by 14 years ago.
LAMP Portal - Configuration Status after pushing changes to UNIS.
-
snmpma.png (250.8 KB) - added by 14 years ago.
LAMP Portal - SNMP MA metadata information.
-
psb_bwctl.png (100.2 KB) - added by 14 years ago.
LAMP Portal - perfSONARBUOY MA (Throughput) dataset metadata page.
-
lamp-sendmanifest.2.py (31.0 KB) - added by 12 years ago.
send-manifest with rspec v3 support
-
lamp-sendmanifest.py (31.0 KB) - added by 12 years ago.
send-manifest with rspec v3 support