
| Version 1 (modified by , 13 years ago) (diff) |
|---|
INSTOOLS Data
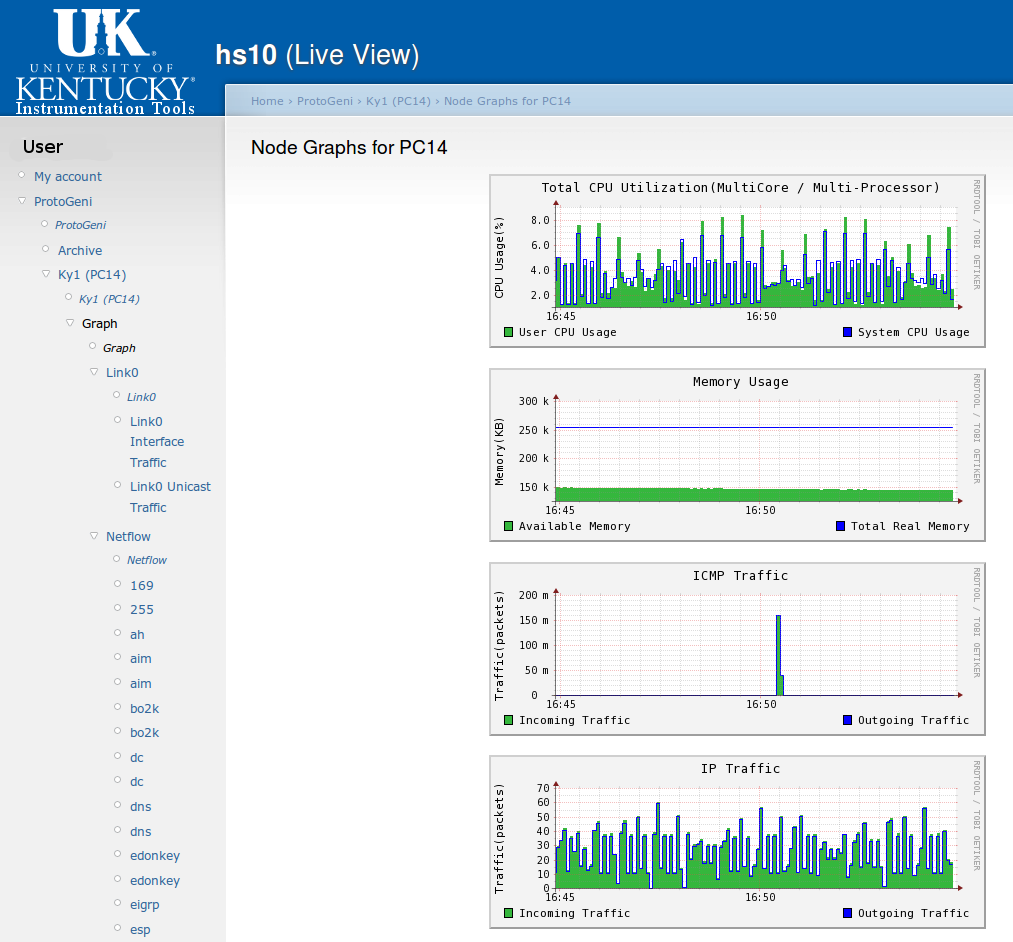
When a slice is instrumented using the INSTOOLs instrumentation scripts, INSTOOLs automatically begins collecting traffic measurement data for the slice. The following provides and overview of the types of data that are collected and made available by INSTOOLs. This information is presented to the user via the INSTOOLs Live View interface.
Tables
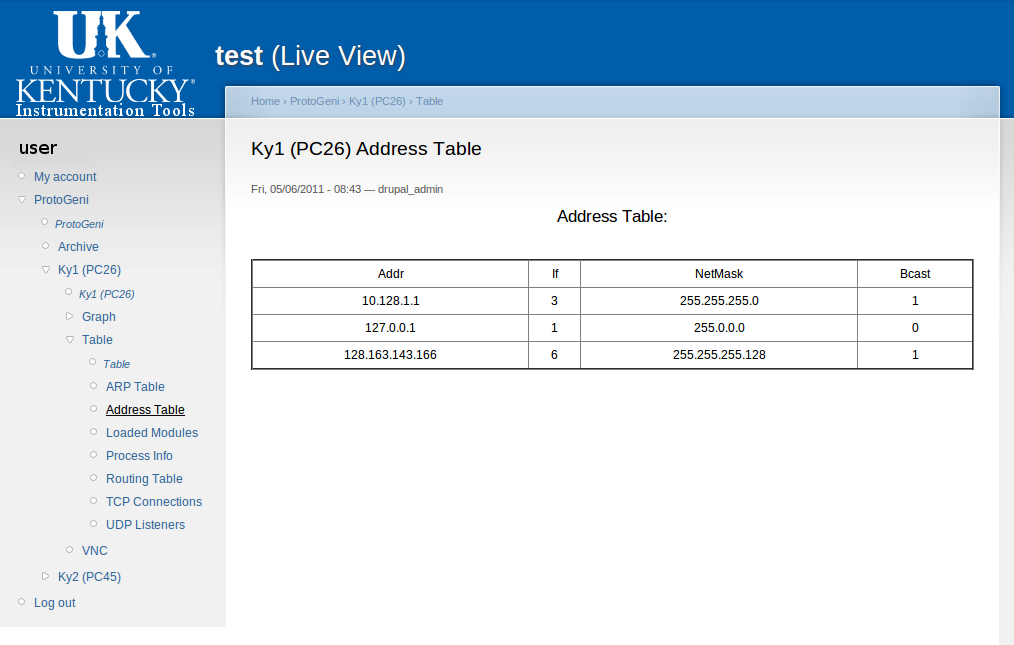
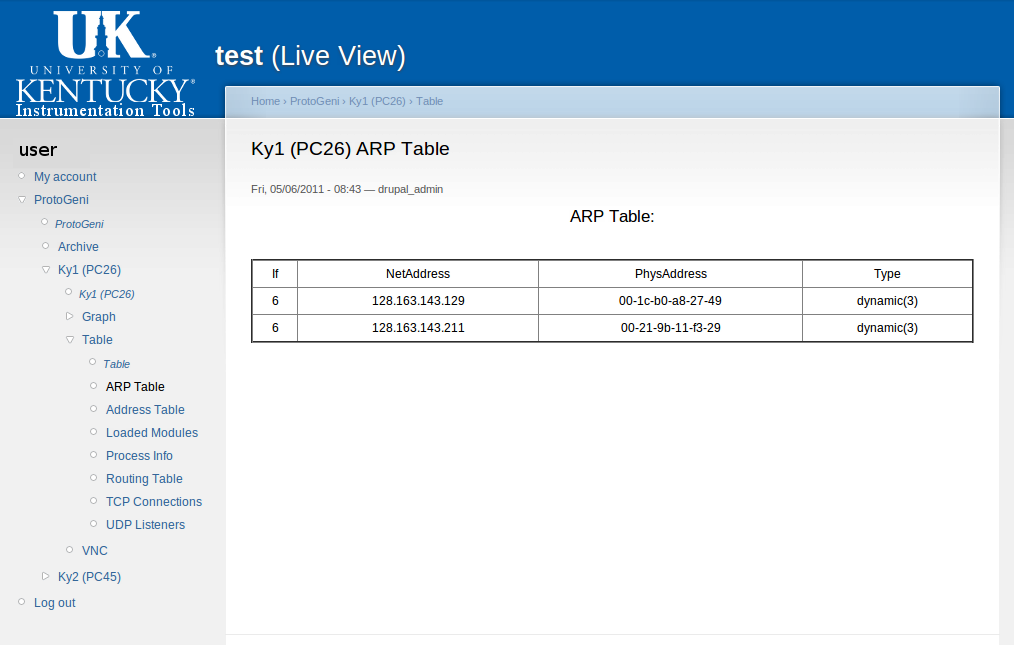
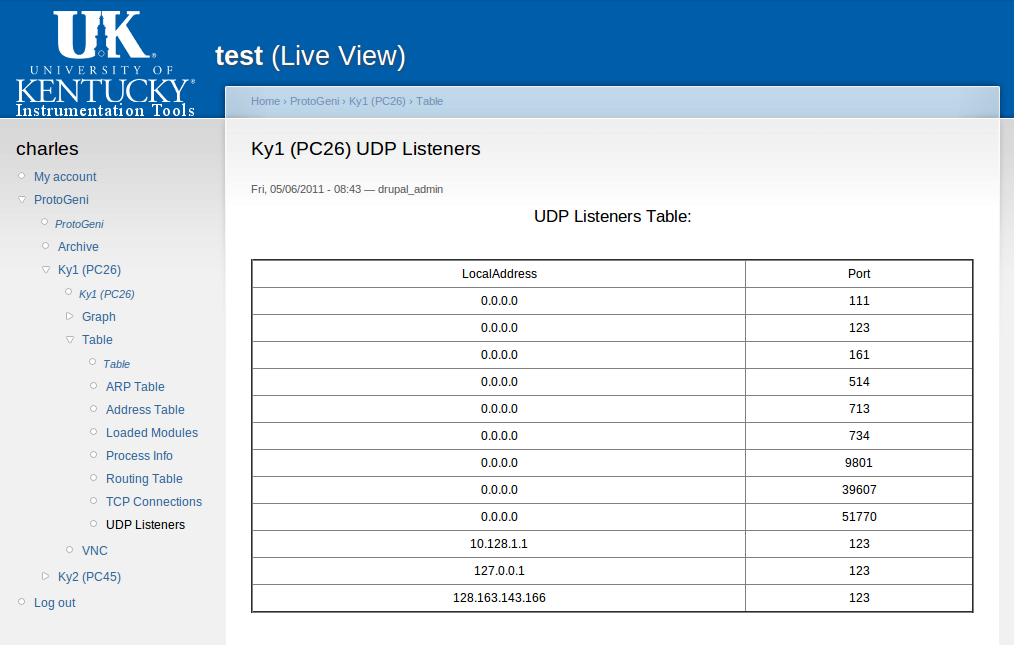
INSTOOLs shows the contents of a variety of configuration tables, routing tables, caches, etc. The following is a list of tables that are available on most network nodes:
- Routing Table
- ARP Table
- Process Table
Graphs
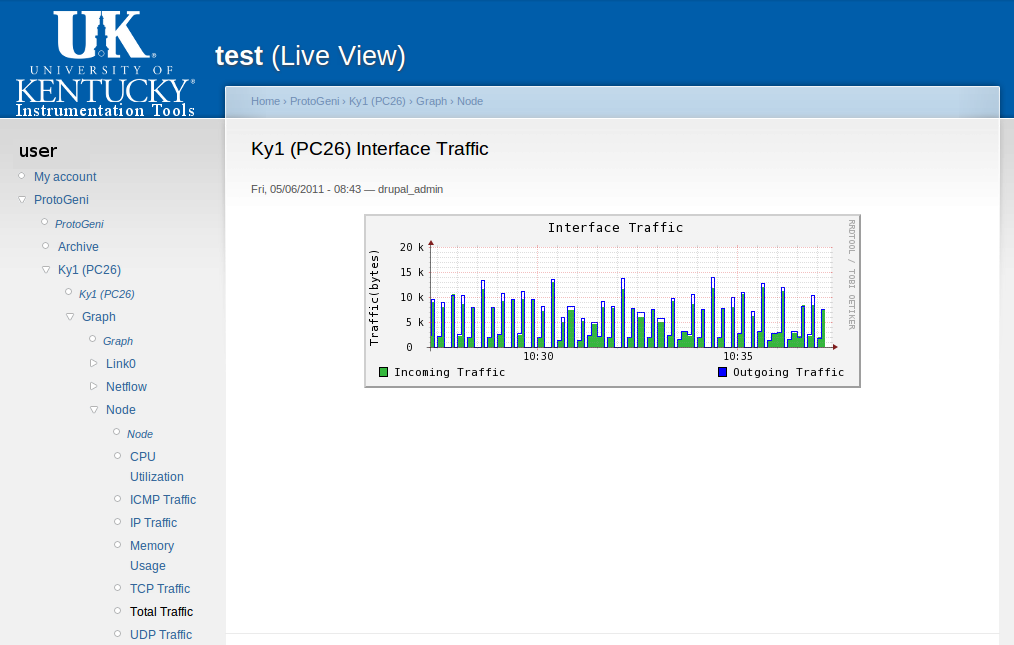
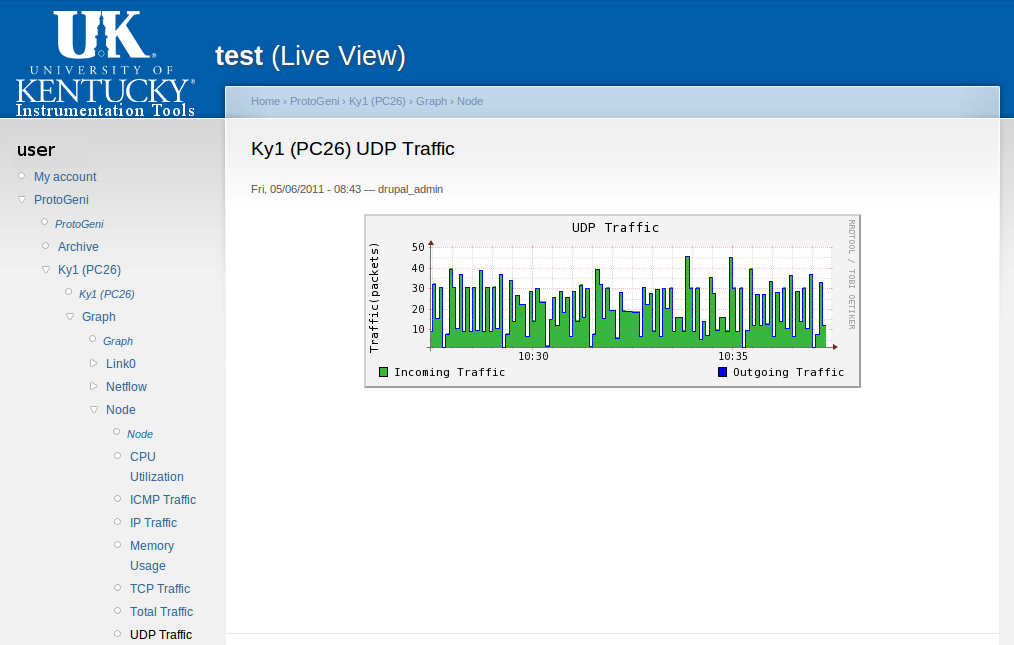
INSTOOLs is able to plot traffic graphics for nodes and links. In particular, the following graphs are generated automatically by INSTOOLs:
- IP Link Traffic Graph
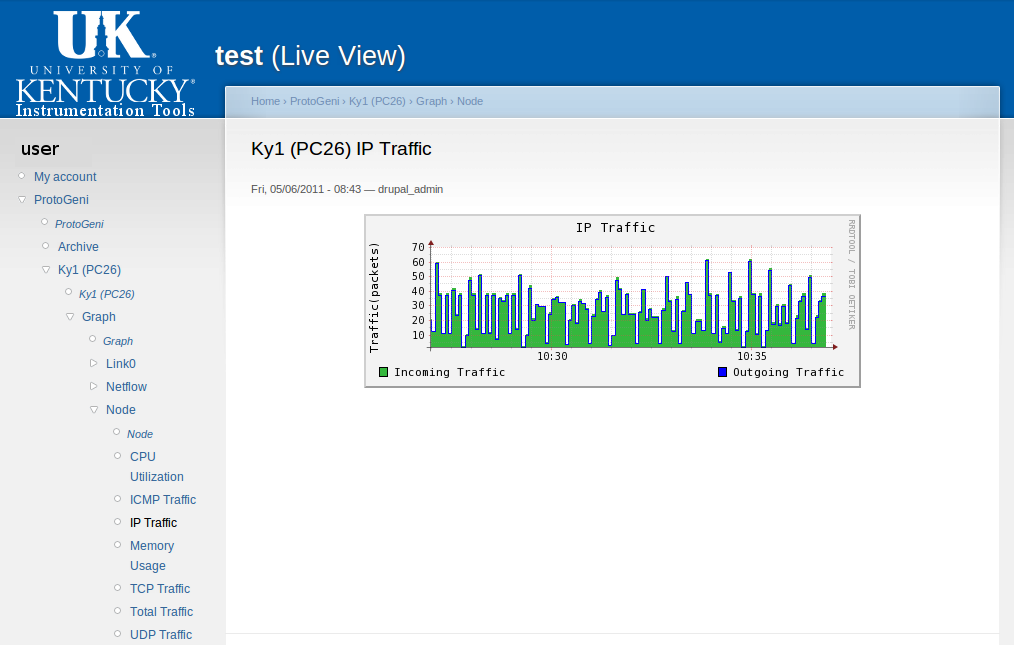
- IP Node Traffic Graph
- TCP Link Traffic Graph
Attachments (10)
-
Screenshot.png (114.9 KB) - added by 13 years ago.
INSTOOLs Screenshot of Network Traffic Graphs
-
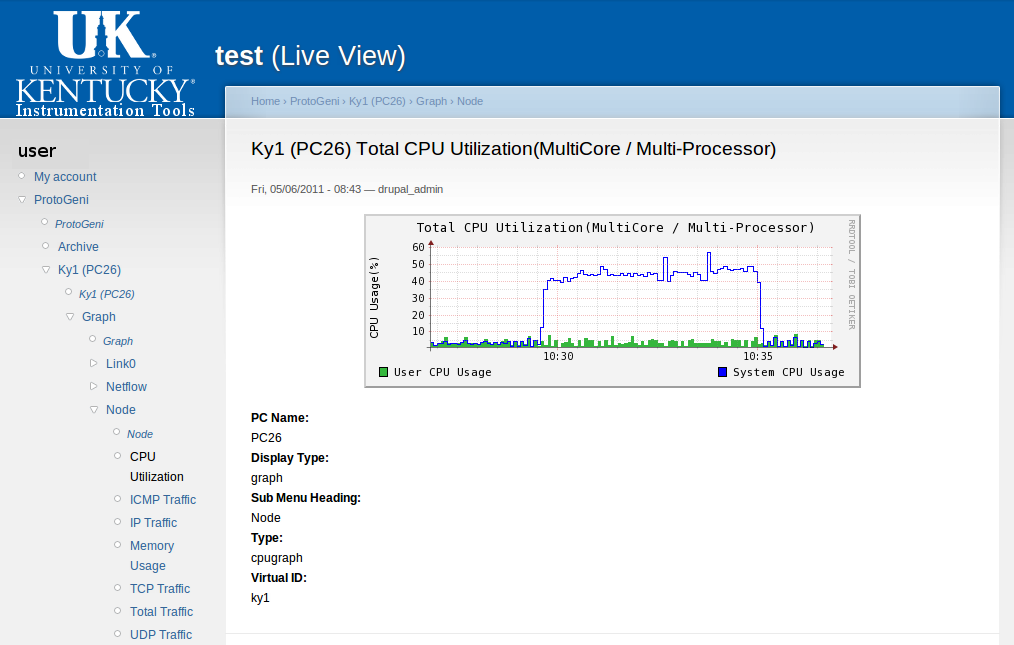
graph_cpu_u.png (79.9 KB) - added by 13 years ago.
CPU Graph
-
graph_ip_traffic.png (68.0 KB) - added by 13 years ago.
IP Graph
-
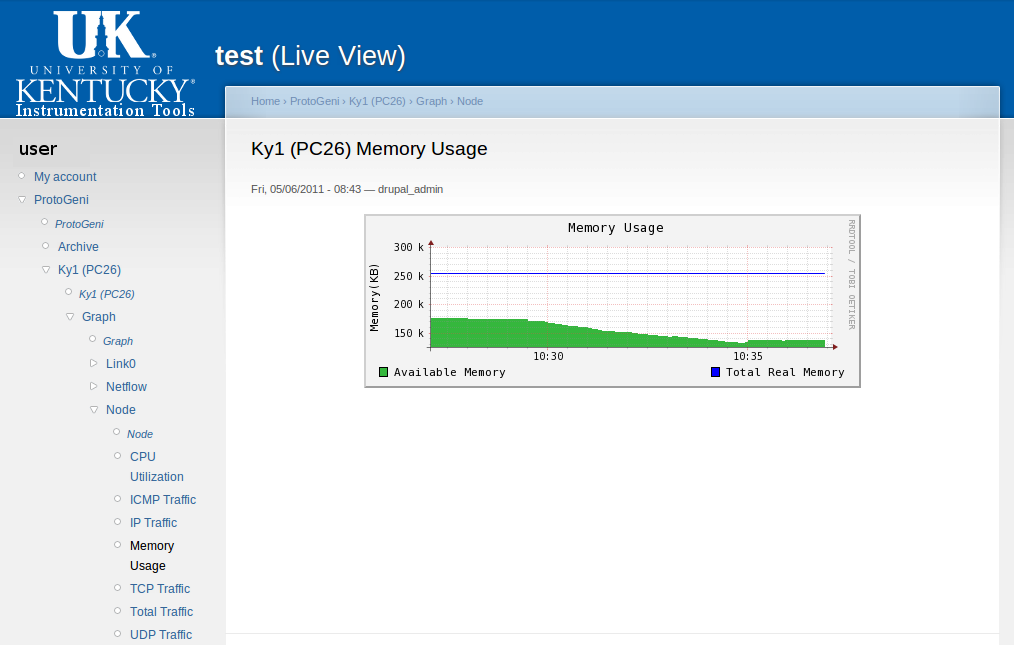
graph_memory.png (66.9 KB) - added by 13 years ago.
Memory Graph
-
graph_traffic.png (74.6 KB) - added by 13 years ago.
Traffic Graph
-
graph_udp.png (67.2 KB) - added by 13 years ago.
UDP Graph
-
table_address.png (72.9 KB) - added by 13 years ago.
Address Table
-
table_arp.png (67.4 KB) - added by 13 years ago.
ARP Table
-
table_udp.png (79.4 KB) - added by 13 years ago.
UDP Table
-
graph_cpu_u.2.png (71.0 KB) - added by 13 years ago.
CPU Graph
Download all attachments as: .zip