
| Version 1 (modified by , 11 years ago) (diff) |
|---|
Passive Measurements
The set of passive measurements being collected include
Graphs
For each Node
- CPU Utilization
- Memory Utilization
- UDP Traffic
- TCP Traffic
- ICMP Traffic
- IP Traffic
- Total Traffic
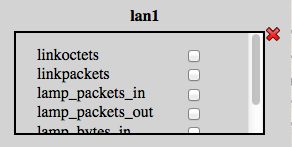
For each Link Interface
- Link packets count
- Link Octet count
7.2 Tables
- Routing Table
- ARP Table
- Interface Address Table
- TCP Connections Table
- UDP Listeners Table
- Kernel Modules Table
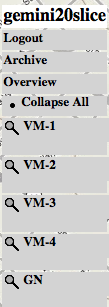
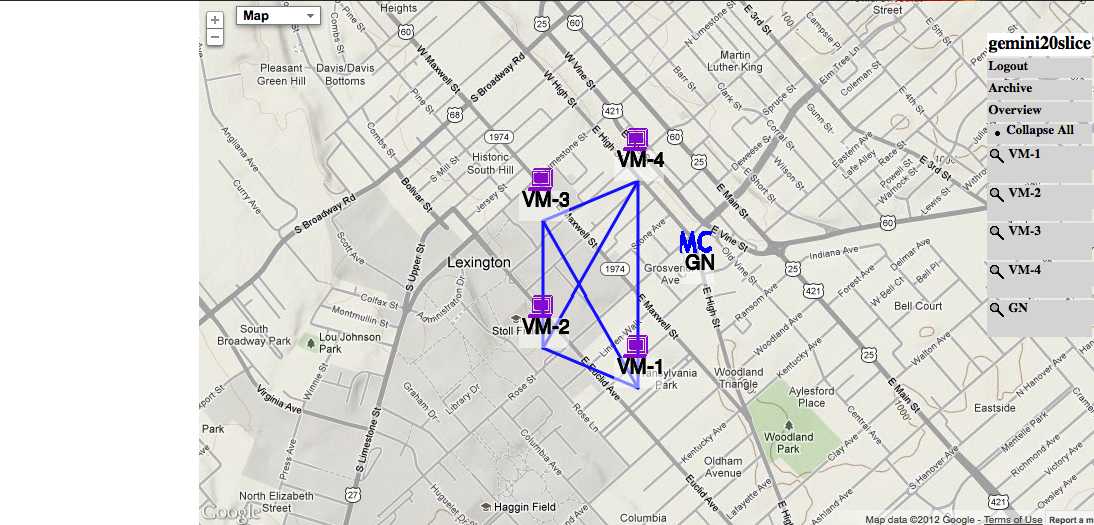
These tables and graphs are collected live and refreshed every 5 seconds and can be accessed using the geminiportal site as shown in the screenshots below.

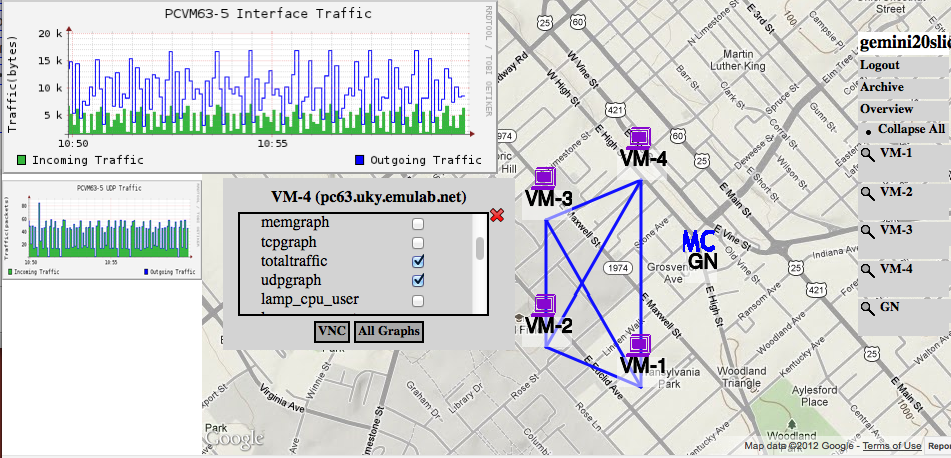
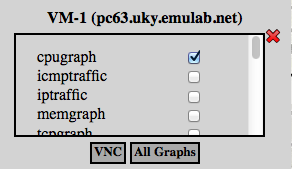
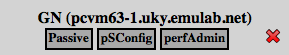
7.3 Reconfigure Passive Data Collection and Display
The data collection and display of these graphs and tables can be reconfigured as per your requirement by accessing the config page from the Global Node which is linked from the GEMINIportal.
As shown in the screenshots above, select/deselect the options according to your requirement and click Apply Configuration at the bottom of the page. Please wait for the reconfiguration to complete and the page stops loading.
Then Refresh/Reload the Main Graph display page in your browser to view the changes.
Attachments (10)
- terminal_icon.png (8.0 KB) - added by 11 years ago.
- mc_icon.png (6.9 KB) - added by 11 years ago.
- gemini_portal_control_panel.png (18.4 KB) - added by 11 years ago.
- initial_slice_view.png (687.6 KB) - added by 11 years ago.
- gemini_portal_logon.png (43.8 KB) - added by 11 years ago.
- gemini_portal_overview.png (429.5 KB) - added by 11 years ago.
- graph_control_form.png (18.2 KB) - added by 11 years ago.
- sample_graph.png (35.6 KB) - added by 11 years ago.
- lan_control_form.png (11.8 KB) - added by 11 years ago.
- mc_control_form.png (11.0 KB) - added by 11 years ago.
Download all attachments as: .zip