| Version 3 (modified by , 12 years ago) (diff) |
|---|
On Time Measurements Tools
The On Time Measurements tools V1.0 is still being evaluated.
On Time Measurement software is available at:
http://ontime.oar.net/download/OnTimeMeasure-v1.0.tar.gz
Software installation instructions are at available at:
http://groups.geni.net/geni/wiki/OnTime-Installv1
User account is required for Research Portal at http://ontime.oar.net/ to add and control OnTimeMeasure service within user's ProtoGENI slice.
An OnTimeMeasure Tutorial is available which provide a useful overview of features and usage.
Time frame: This evaluation took place from June 4 through July 21, 2010.
On Time Measurement Tools Findings
The software package delivers a README that includes Copyright information and some modification history. An installation pdf is enclosed, thus creating a need for an undocumented requirement to install Acroread. Request was submitted for text install instructions.
Suggested installation instruction document restructuring to streamline and clarify instructions to users. Found few prerequisites no captured. Requested that ports used be undocumented. See attached Install Feedback for a compilation of feedback on installation instructions. Majority of input has been implemented in latest release.
Suggested restructuring release package to simplify installation of the possible node types, input has been implemented in latest version, where the content of each node type is packaged individually. See attached Feedback Compilation for details and dispatch for each request.
Various configuration syntax issues were found with files delivered, such as spaces being interpreted and case mismatch. The graphite database had incorrect permissions, due to the installation script setting permissions at the wrong time.
Outstanding Issues:
- Only one experiment can be handled per user account.
- Once the experiment is defined it cannot be modified.
- Domain names are not handled by parts the system.
While evaluating this package found features that are not yet documented:
- A Node Beacon can run both Centralized and Distributed orchestrations concurrently.
- A node can run Root Beacon and Node Beacon concurrently.
To Debug Ontime Measurement tools problems simply run all "nohup" processes in the fore ground without nohup. This will show all operations in the xterm where the process is started.
On Time Measurement Tools How-to
Installation instructions capture all requirements, also scripts are delivered that install all prerequisites.
Two types of configurations are supported, which are referred to as orchestrations:
- Distributed orchestration - Includes only Node Beacons
- Centralized Orchestration - Includes Node Beacons and Root Beacons.
Following is a capture of the Centralized Orchestration On ProtoGENI Nodes. Using ProtoGENI tools registered a slice:
lnevers@riva:~/protogeni-tests$ ./registerslice.py -n ln_slice_pgt
Got my SA credential
No such slice registered here:Creating new slice called ln_slice_pgt
New slice created: urn:publicid:IDN+emulab.net+slice+ln_slice_pgt
and created a sliver with 3 nodes:
lnevers@riva:~/protogeni-tests$ ./createsliver.py -n ln_slice_pgt 3node.xml
Got my SA credential
Asking for slice credential for ln_slice_pgt
Got the slice credential
Creating the Sliver ...
Created the sliver
<rspec xmlns="http://protogeni.net/resources/rspec/0.1">
 <node virtual_id="geni1" virtualization_type="raw" exclusive="1" component_urn="urn:publicid:IDN+emulab.net+node+pc321" component_uuid="de9ea263-773e-102b-8eb4-001143e453fe" component_manager_urn="urn:publicid:IDN+emulab.net+authority+cm" component_manager_uuid="28a10955-aa00-11dd-ad1f-001143e453fe" sliver_uuid="de9ea263-773e-102b-8eb4-001143e453fe" hostname="pc321.emulab.net" sshdport="22" sliver_urn="urn:publicid:IDN+emulab.net+sliver+12127">
   <interface virtual_id="virt0" component_id="eth4"/>
   <disk_image name="urn:publicid:IDN+emulab.net+image+emulab-ops//FEDORA8-STD"/>
 <services><login authentication="ssh-keys" hostname="pc321.emulab.net" port="22"/></services></node>
 <node virtual_id="geni2" virtualization_type="raw" exclusive="1" component_urn="urn:publicid:IDN+emulab.net+node+pc217" component_uuid="de9fca0e-773e-102b-8eb4-001143e453fe" component_manager_urn="urn:publicid:IDN+emulab.net+authority+cm" component_manager_uuid="28a10955-aa00-11dd-ad1f-001143e453fe" sliver_uuid="de9fca0e-773e-102b-8eb4-001143e453fe" hostname="pc217.emulab.net" sshdport="22" sliver_urn="urn:publicid:IDN+emulab.net+sliver+12128">
   <interface virtual_id="virt0" component_id="eth2"/>
   <interface virtual_id="virt1" component_id="eth4"/>
   <disk_image name="urn:publicid:IDN+emulab.net+image+emulab-ops//FEDORA8-STD"/>
 <services><login authentication="ssh-keys" hostname="pc217.emulab.net" port="22"/></services></node>
 <node virtual_id="geni3" virtualization_type="raw" exclusive="1" component_urn="urn:publicid:IDN+emulab.net+node+pc354" component_uuid="de9dfa4f-773e-102b-8eb4-001143e453fe" component_manager_urn="urn:publicid:IDN+emulab.net+authority+cm" component_manager_uuid="28a10955-aa00-11dd-ad1f-001143e453fe" sliver_uuid="de9dfa4f-773e-102b-8eb4-001143e453fe" hostname="pc354.emulab.net" sshdport="22" sliver_urn="urn:publicid:IDN+emulab.net+sliver+12129">
   <interface virtual_id="virt0" component_id="eth4"/>
   <disk_image name="urn:publicid:IDN+emulab.net+image+emulab-ops//FEDORA8-STD"/>
 <services><login authentication="ssh-keys" hostname="pc354.emulab.net" port="22"/></services></node>
 <link virtual_id="link0" link_type="VLAN" sliver_uuid="486be29b-8059-11df-ad83-001143e453fe" sliver_urn="urn:publicid:IDN+emulab.net+sliver+12130">
   <interface_ref virtual_interface_id="virt0" virtual_node_id="geni1" sliver_uuid="48c1eb45-8059-11df-ad83-001143e453fe" component_urn="urn:publicid:IDN+emulab.net+interface+pc321:eth4" sliver_urn="urn:publicid:IDN+emulab.net+sliver+12131" MAC="000423a8fc0e" IP="10.10.1.1"/>
   <interface_ref virtual_interface_id="virt0" virtual_node_id="geni2" sliver_uuid="49372ba4-8059-11df-ad83-001143e453fe" component_urn="urn:publicid:IDN+emulab.net+interface+pc217:eth2" sliver_urn="urn:publicid:IDN+emulab.net+sliver+12132" MAC="000423b71496" IP="10.10.2.1"/>
 </link>
 <link virtual_id="link1" link_type="VLAN" sliver_uuid="49f0b3ea-8059-11df-ad83-001143e453fe" sliver_urn="urn:publicid:IDN+emulab.net+sliver+12133">
   <interface_ref virtual_interface_id="virt1" virtual_node_id="geni2" sliver_uuid="4a815d37-8059-11df-ad83-001143e453fe" component_urn="urn:publicid:IDN+emulab.net+interface+pc217:eth4" sliver_urn="urn:publicid:IDN+emulab.net+sliver+12134" MAC="000423b714a6" IP="10.10.1.2"/>
   <interface_ref virtual_interface_id="virt0" virtual_node_id="geni3" sliver_uuid="4af60f64-8059-11df-ad83-001143e453fe" component_urn="urn:publicid:IDN+emulab.net+interface+pc354:eth4" sliver_urn="urn:publicid:IDN+emulab.net+sliver+12135" MAC="000423b71e02"/>
 </link>
<!--
 <valid_until>2010-08-14T12:00:00</valid_until>
 -->
</rspec>
The above set up 3 FEDORA 8 nodes which are used as follows:
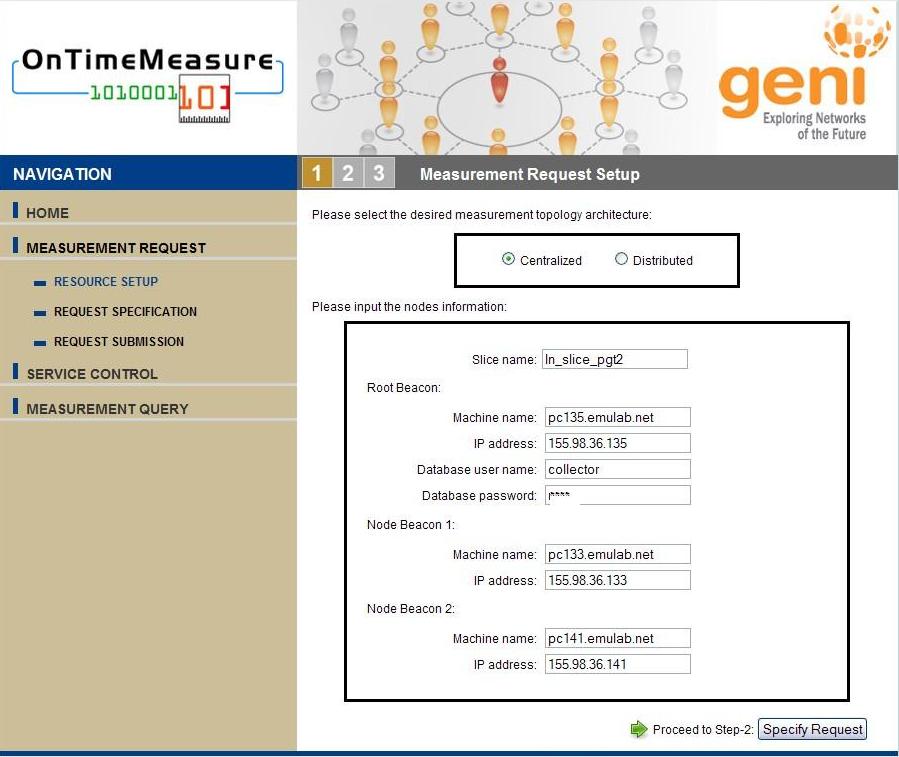
 pc133.emulab.net => Root Beacon
 pc135.emulab.net => Node Beacon
 pc141.emulab.net => Node Beacon
Once the slices are created, the user request an account at the OnTimeMeasure Portal. The Registration request can be started by clicking on the "Register" button at http://ontime.oar.net/. This brings up the registration page:
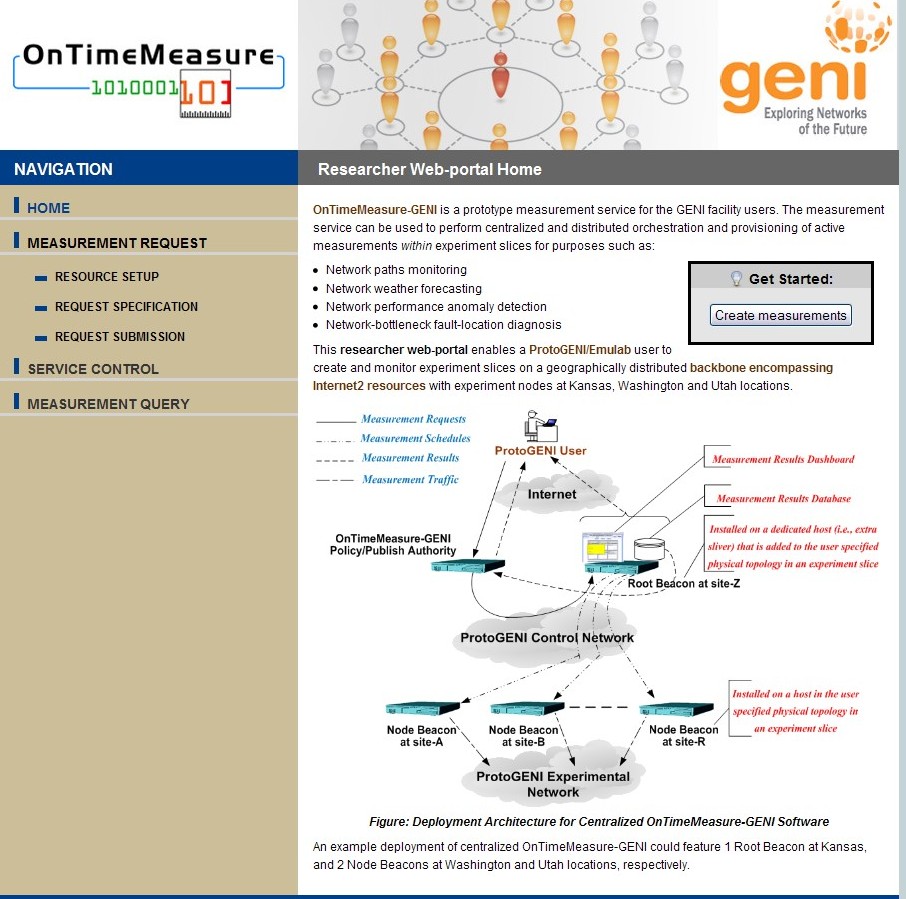
Once account is enabled, user must register the nodes that are part of the experiment by clicking the "Create Measurements" button on main page:
Choosing "Create Measurement" brings up the "Resource Setup" Pages, which is the first of 3 steps required node to set up monitoring:
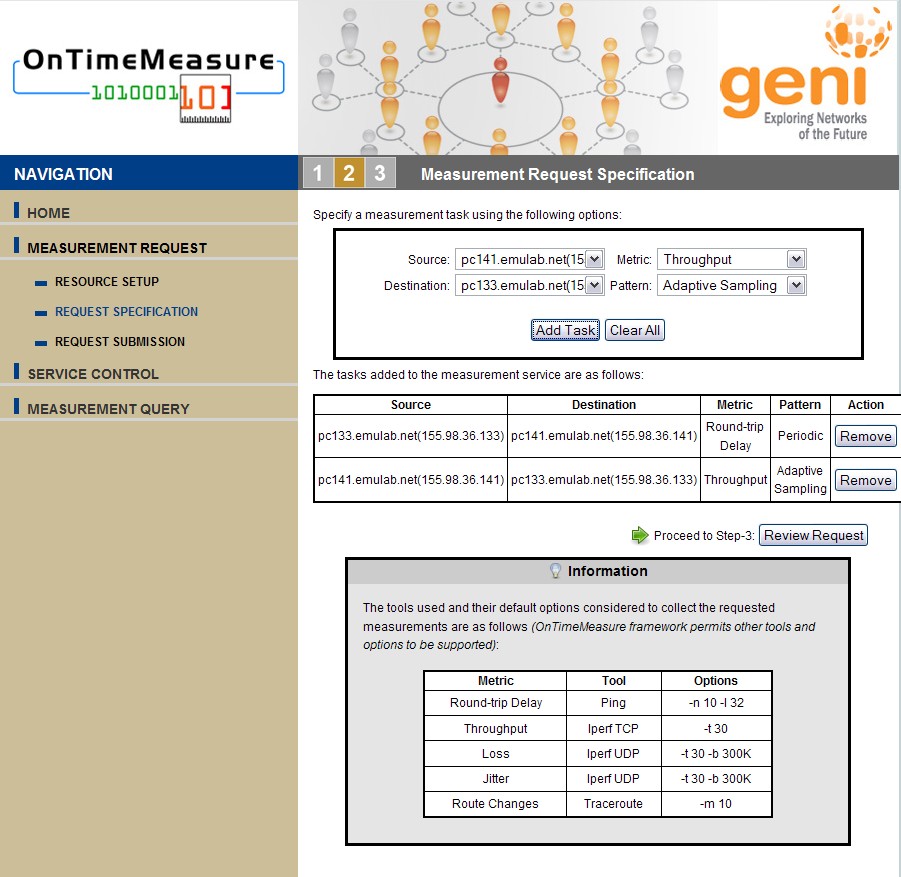
Next, the "Measurement Request Specification" must be defined where the user can choose the nodes, types of metric and time pattern to be executed for the monitoring. The following pages show two measurement tasks defined:
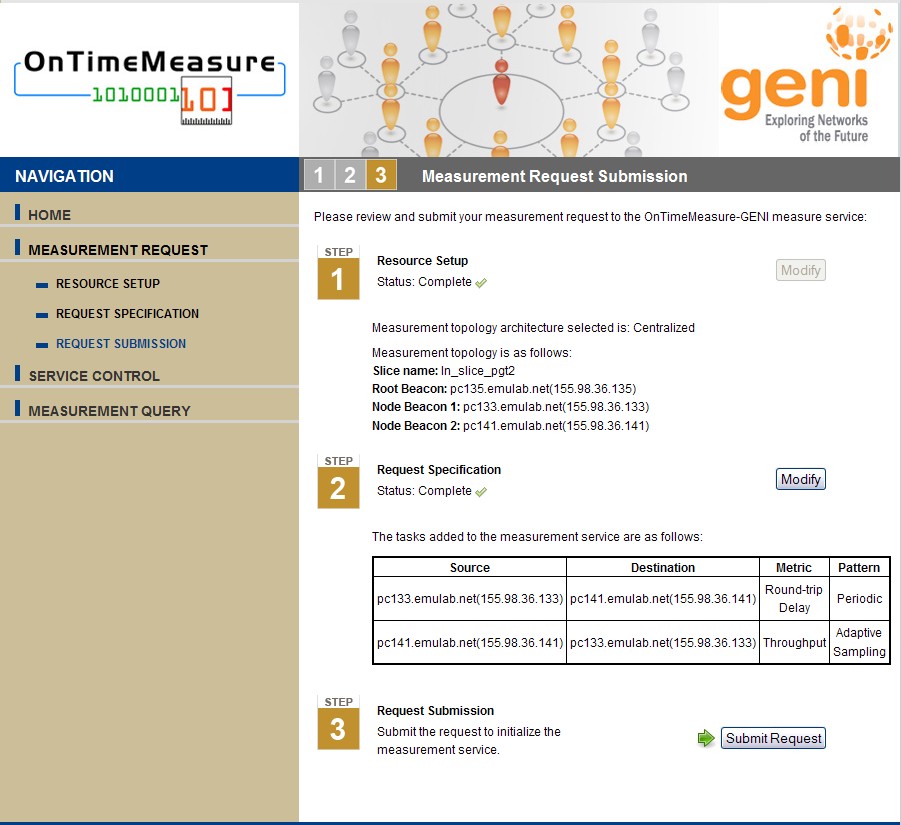
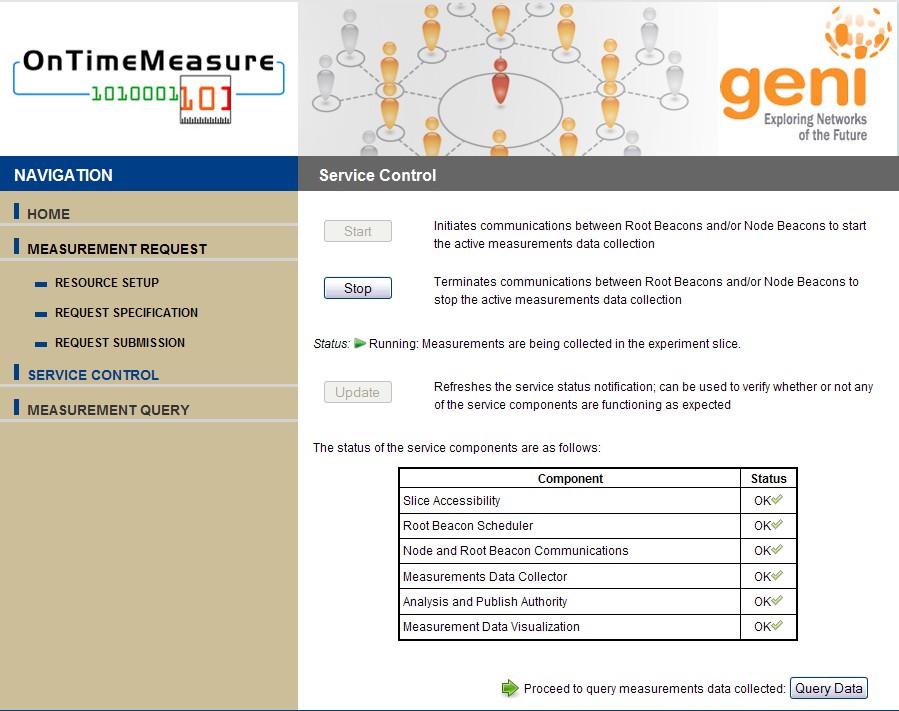
Once node are registered and measurements are defined the user start measurement collection:
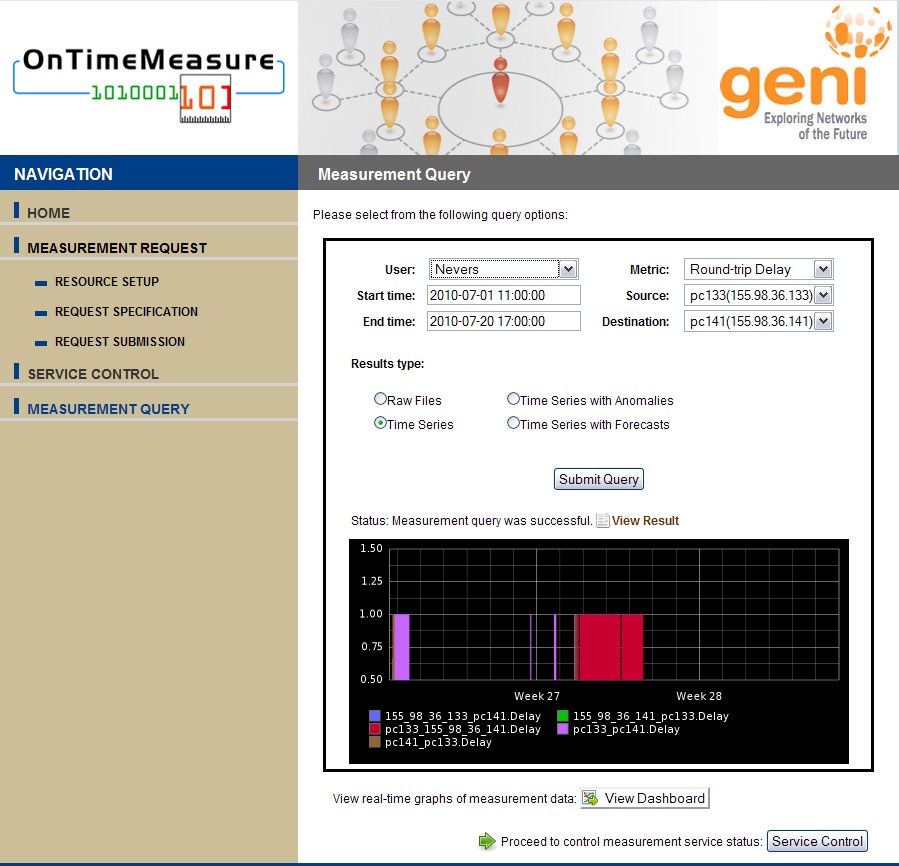
Once measurements are being collected, the user may query for the measurement collected:
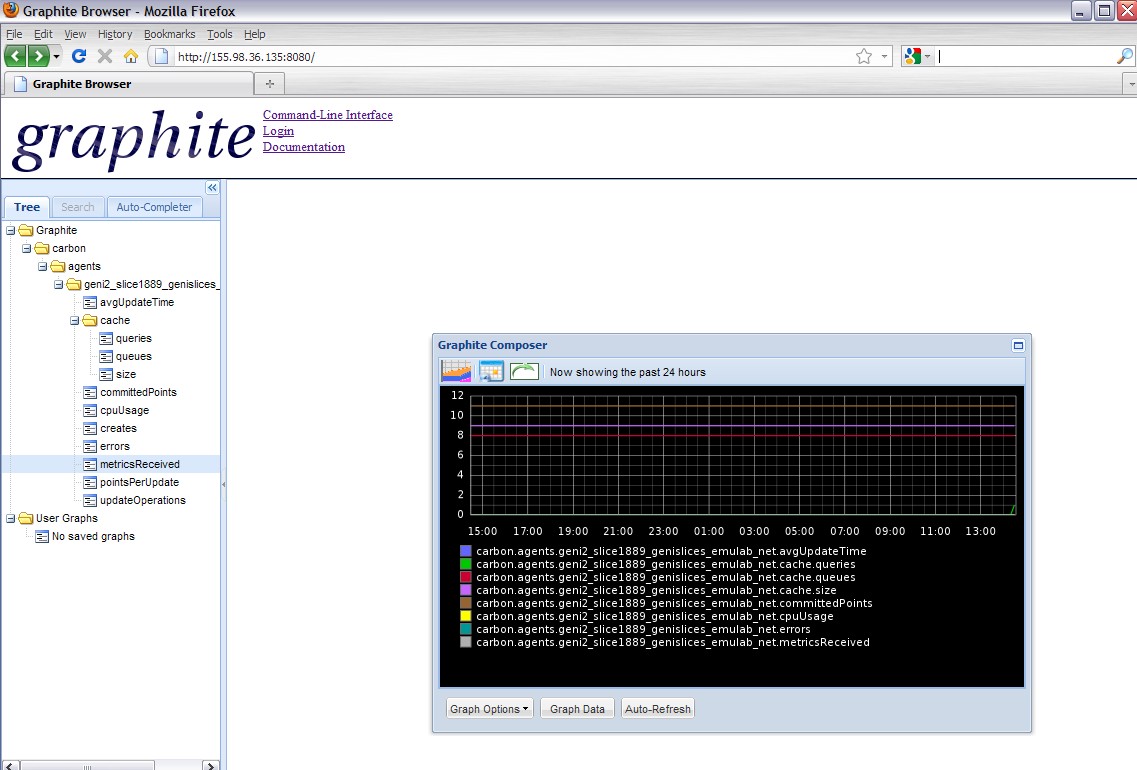
Once data is collected, the user can view real-time graphs of measurement data details from the dashboard via their own graphite portal:
MORE TO BE ADDED when DATA is collected and can be displayed in portal.
Attachments (11)
- Luisa-Feedback-Compilation_062310.pdf (30.8 KB) - added by 14 years ago.
- OnTimeMeasure_Install_Instructions-feedback-20100623.doc (89.5 KB) - added by 14 years ago.
- 2010-06-25_Ontime-0.jpg (129.4 KB) - added by 14 years ago.
- 2010-06-25_Ontime-2.jpg (152.9 KB) - added by 14 years ago.
- 2010-06-28_Ontime-6.jpg (145.8 KB) - added by 14 years ago.
- 2010-06-28_Ontime-4.jpg (74.1 KB) - added by 14 years ago.
- 2010-06-25_Ontime-1.jpg (172.8 KB) - added by 14 years ago.
- 2010-06-28_Ontime-7.jpg (131.8 KB) - added by 14 years ago.
- 2010-06-29_Ontime-8.jpg (122.3 KB) - added by 14 years ago.
- 2010-06-30_Ontime-9.jpg (143.7 KB) - added by 14 years ago.
- 2010-07-21Ontime-11.jpg (133.8 KB) - added by 14 years ago.
Download all attachments as: .zip


