
| Version 12 (modified by , 11 years ago) (diff) |
|---|
D. Observe Results

D.1 Labwiki
Labwiki is a tool which provides a user-friendly interface to visualize your experiment. To know more about Labwiki please visit Labwiki
Labwiki can be used to Plan, Prepare and Run your Experiment.
D.1.1 Plan
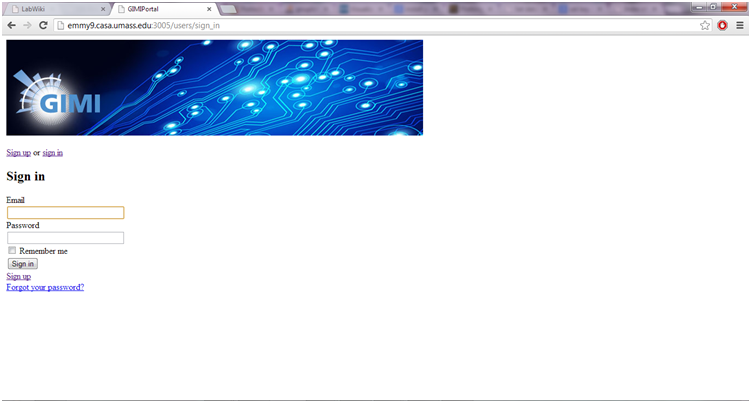
Labwiki accounts have already been created for you for this tutorial. To use Labwiki, go to GIMI portal and login with the username and password you have been given.

Figure (1)
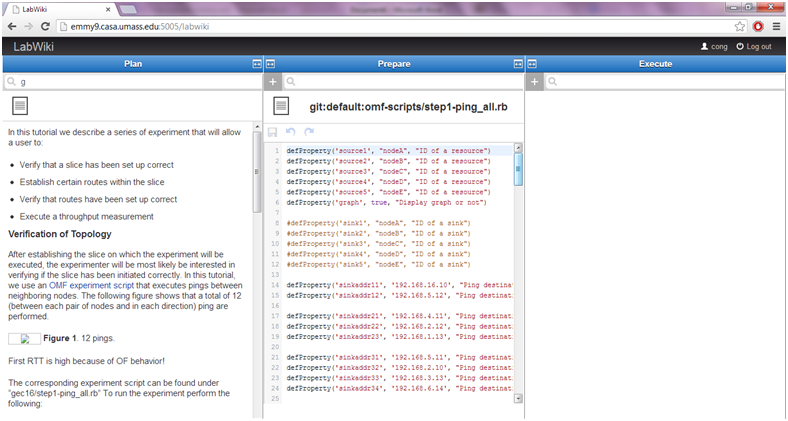
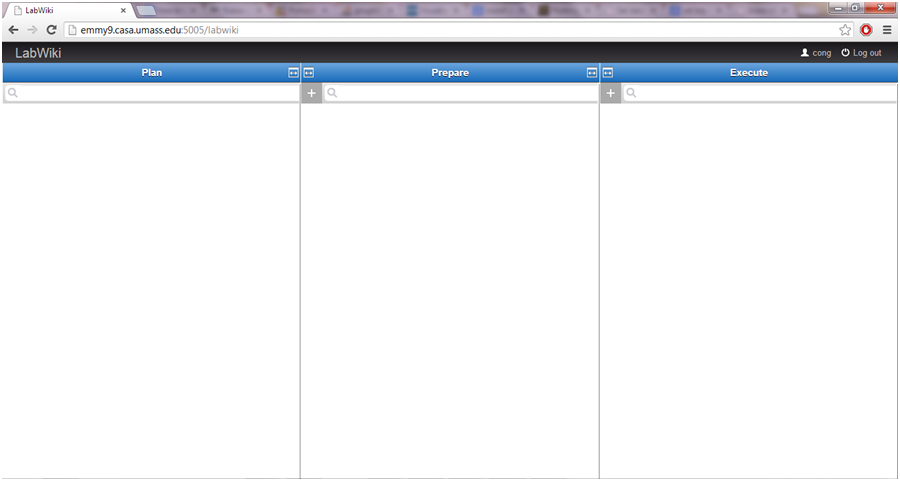
After you have successfully been signed in you will be able to see a screen like the one below.

Figure (2)
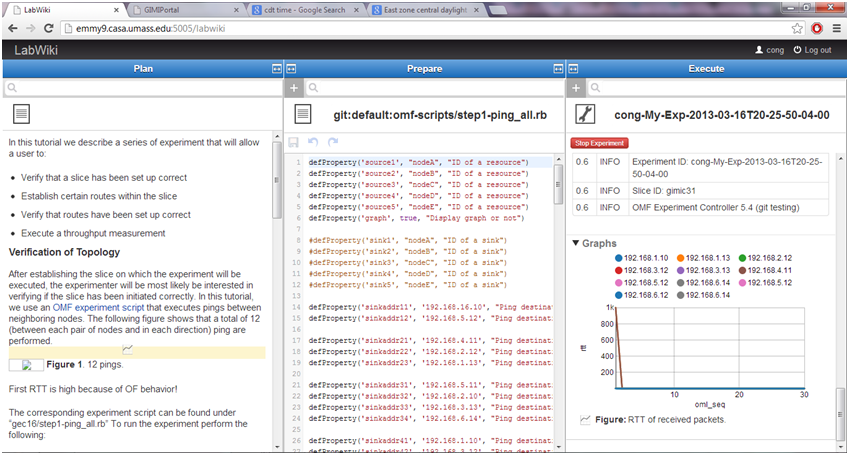
The left column could contain the steps to run the experiment or general information about the experiment.

Figure (3)
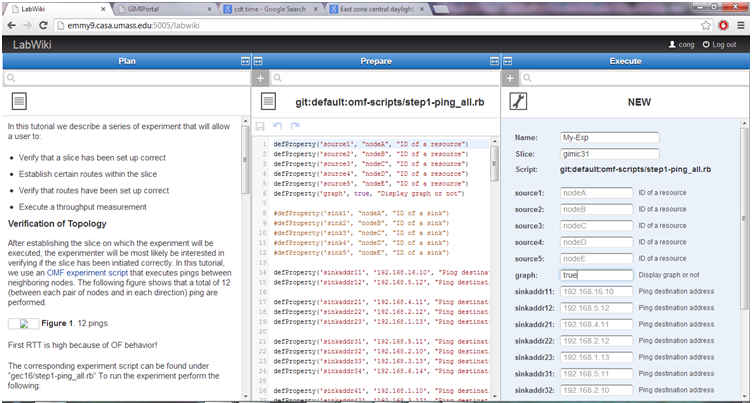
D.1.2 Prepare
In the Prepare column, you can select the experiment that you want to execute. In this column you will also be able to edit your experiment script.

Figure (4)
After editing, click on the save icon at the top of the column to save your script.
Next, click and drag the icon at the top left corner over to the right column Execute.
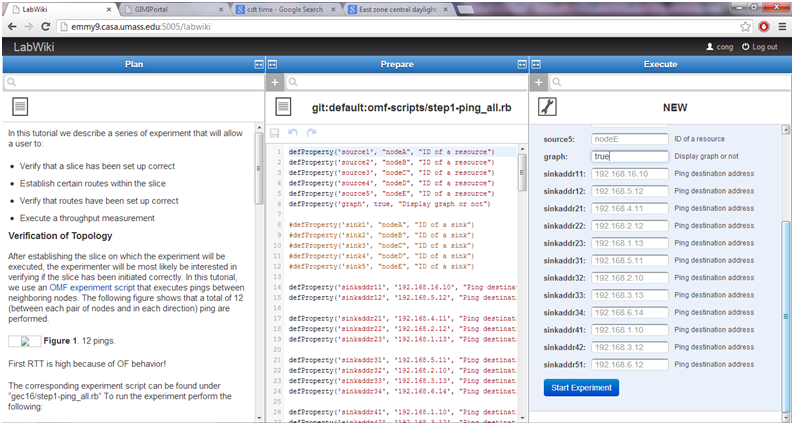
D.1.3 Execute
Here, you can start your experiment and Visualise it. In the name tab, type in the name you wish to give the experiment. There are no particular rules for this.
Under slice name, type in the name of your slice as you have entered in the Flukes tool while setting up your slice.
Then. scroll towards the bottom of this column and under the tab named Graph, type 'true'.This enables the graph view on your execute column.
Once the experiment starts running you will be able to scroll down and view the graph.

Figure(5)
Click on 'Start Experiment' at the bottom of the screen.

Figure(6)
After a couple of seconds, you can see the graph at the bottom of the screen.
 Figure (7)
You can click and drag it to the Plan screen just above Figure 12. This will display the graph along with the experiment description. This graph is also dynamic.
 Figure (8)
You can click and drag the experiment description to the Prepare column. This allows you to add any comments or details about the experiment results.
Similarly, Experiments 2 and 3 can be run using the same procedure. Experiment 2 does not have a graph.

Figure(9)
Once you have your slice up and running you can visualize any experiment using Labwiki.
Attachments (9)
- Labwiki_1.png (135.5 KB) - added by 11 years ago.
- Labwiki_2.png (95.0 KB) - added by 11 years ago.
- Labwiki_3.png (157.7 KB) - added by 11 years ago.
- Labwiki_4.png (198.0 KB) - added by 11 years ago.
- Labwiki_5.png (233.9 KB) - added by 11 years ago.
- Labwiki_6.png (218.0 KB) - added by 11 years ago.
- Labwiki_7.png (228.9 KB) - added by 11 years ago.
- Labwiki_8.png (249.1 KB) - added by 11 years ago.
- Labwiki_2a.png (54.7 KB) - added by 11 years ago.
Download all attachments as: .zip