
| Version 16 (modified by , 11 years ago) (diff) |
|---|
Description
In this tutorial experimenters will perform SDN/OpenFlow (OF) experiments based on provisioned Layer 2 topologies in ExoGENI and VMs running OVS (which implements OF 1.0, 1.2 and 1.3) that mimic the behavior of hardware-based OF switches. The goal is to learn how to provision a topology, how to attach a controller to it, demonstrate basic packet manipulation capabilities using most likely gui-based tools that use north-bound APIs on floodlight (as an exemplar controller). As an additional goal, experimenters will learn how to obtain statistics from measurements on this slice and how these statistics can be used to change flows with the aid of GIMI tools.
Back to GEC16 GIMI tutorials main page
Openflow Tutorial
1.0 Getting Started
To get started ensure that you have flukes up and running on your system. If do not know how to install
flukes please take a look at this page: Flukes.
For this tutorial you will need an image with OVS pre-installed in it. Don't panic, RENCI
provides you an image that has OVS installed in it. To use that, all you need to do is, open the
“.flukes.properties” file in your home directory and add the following lines at the bottom of it.
image2.name=gimi-ovs
image2.url=http://emmy9.casa.umass.edu/Disk_Images/ExoGENI/exogeni-umass-ovs-1.0.2.xml
image2.hash=de35e71b31771870bcdfcccb4dee11657ba145b8
Note: Ensure that you replace XX with the sequence number so that images are mentioned in an order.
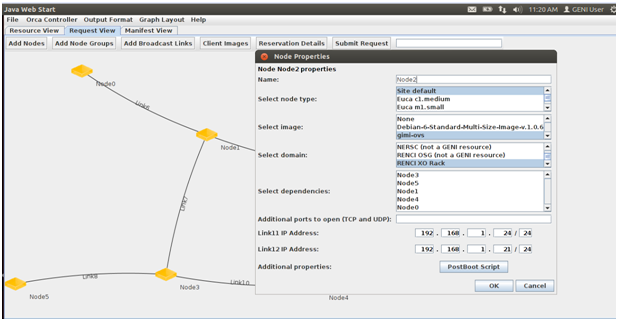
Now, to check if flukes is able to read the image option, open flukes and create a node by left clicking
in the request view pane. After creating the node, right click and select edit properties. You should be
able to find an option in the images section with the name “gimi-ovs”.

Figure (1)
With that you have successfully completed the first step. In the next step, you need to run an Openflow
controller and ensure that it is reachable via Internet. You can run any Openflow controller that is
available, but we will be using floodlight controller for this tutorial.
We have also created a video that demonstrate how to create the ExoGENI slice we are using in this tutorial!
2.0 Running an Openflow Controller
You can download floodlight by clicking on this link Floodlight.
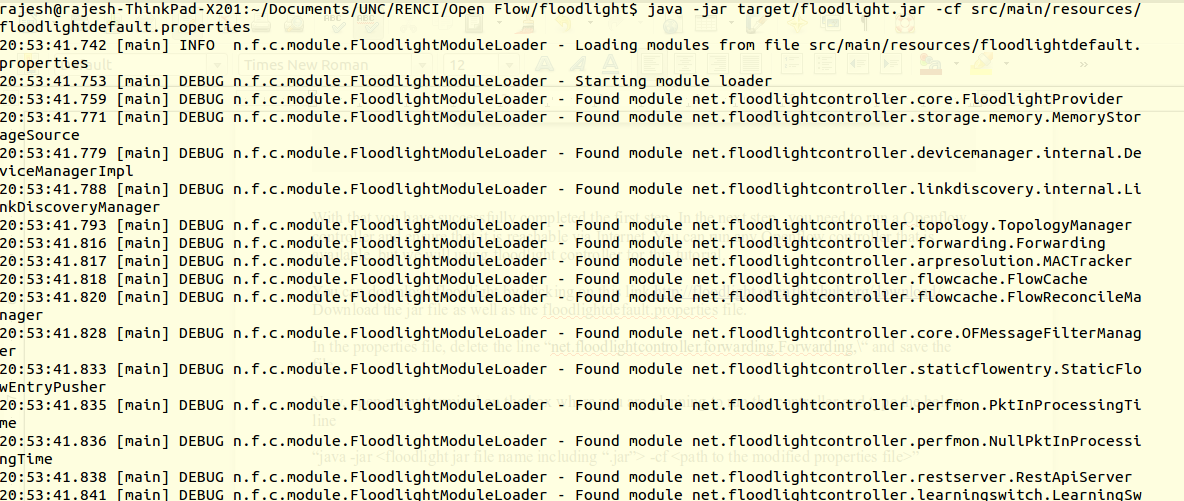
Download the jar file as well as the floodlightdefault.properties file.
In the properties file, delete the line “net.floodlightcontroller.forwarding.Forwarding,\“ and save the
file. Now, open a new terminal on the box where you are planning to run the controller and type the
following line.
“java -jar <floodlight jar file name including “.jar”> -cf <path to the modified properties file>"
If you find the output on your console similar to the ones in the screen shot below then you are done
with setting up the controller.

Figure(2)
Final missing piece is “Avior”, a GUI based tool which is used to manipulate flow entries in the
switches via user friendly interface rather than rest API. Click on the link below to download the jar file
and start running the tool.
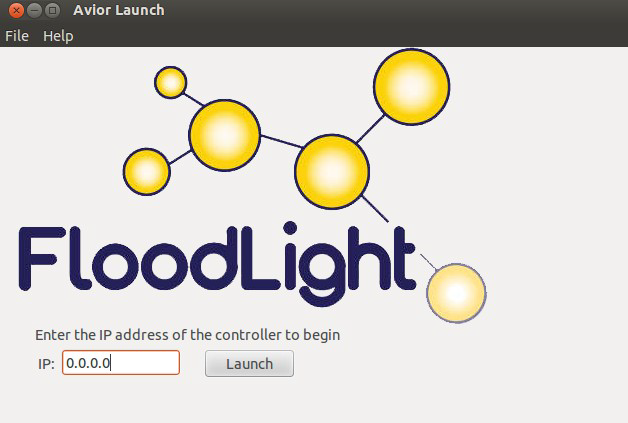
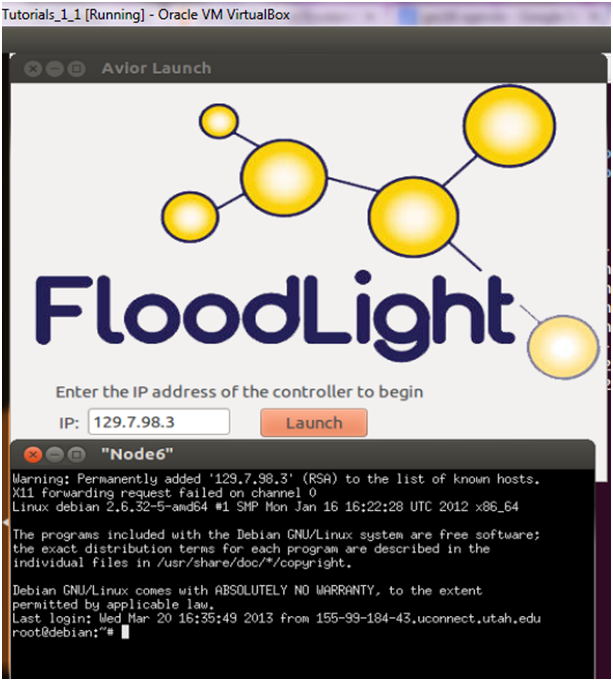
For smooth operation, run this tool on the same box where the controller is running. When you type
“java -jar <path to the Avior jar file>” you should be getting a prompt similar to the one show below.
Enter “0.0.0.0” as the IP [ assuming the controller is running on the same box. If not, then enter the IP
on which controller is reachable] and click on launch button.

Figure(3)
NOTE: Ensure that the controller is running and is reachable from this box.
After clicking on the launch button, a new GUI appears on the screen similar to the one shown below.

Figure(4)
Now you are all set for your first Openflow experiment on ExoGeni.
3.0 Running a simple experiment
3.1 Life of an ICMP packet in an Openflow network:
3.1.0 Creating a topology
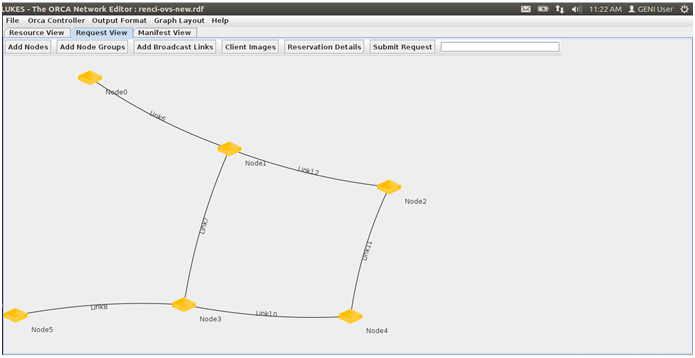
First, we are going to create a simple six node topology with four nodes acting as switches and rest of
them as hosts.

Figure (5)
Here, nodes 0 and 5 are the hosts and rest of them are switches.
Now we need to configure each node before we submit the request for resource allocation. This can be
done by editing the properties of each node [right click and select edit properties].
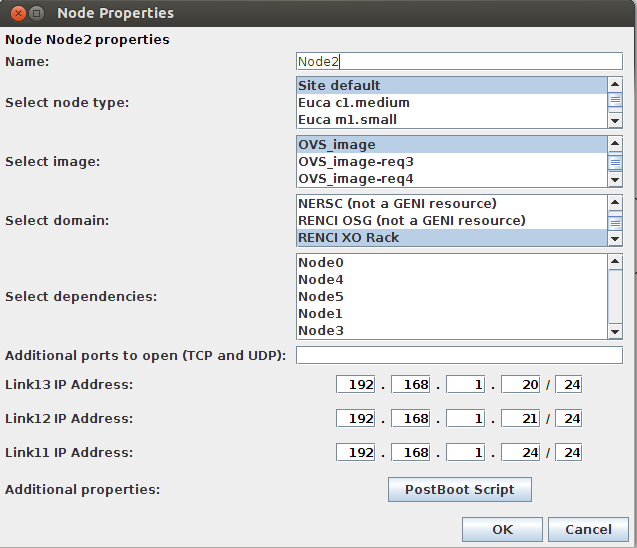
Configure each switch [nodes 1,2,3,4] using the screen shots below as a reference. Configure IP
addresses on each node in such a way that you can tell which node is on the other side of the link by looking
at the IP. For example: link 3 connects nodes 2 and 0, hence IP address on node 2 is configured as
192.168.1.20 to indicate that node 0 is on the other end of the link. Also, select ovs_image as the image
to be used.
Lastly, in the post boot script, copy and paste the commands shown below:
#!/bin/bash
ovs-vsctl add-br test
ovs-vsctl add-port test eth1
ovs-vsctl add-port test eth2
ovs-vsctl add-port test eth3
ovs-vsctl set-controller test tcp:<controller ip address>:6633
ovs-vsctl set-fail-mode test secure
Note:This step has already been performed for the requests you will be using in the tutorial/
The above commands are used to create a data path or a switch [named as test] and add interfaces to it.
The last command configures the controller's IP and port number details using the set-controller command.
Note: Do not forget to add the controller's IP address in the set-controller command.

Figure (6)
The above steps have to be repeated on the remaining three switches.
After we finish configuring switches, we need to configure the hosts. Except for the step where we add
the OVS commands to the post boot script all the other steps described above are to be followed. To
distinguish the hosts from switches, configure the interfaces with IP address from a different sub-net,
say 192.168.2.0/24.
Once you are done configuring the nodes, go ahead and submit the slice by giving it a name. You can
check the status of your request in the manifest view by specifying the name of the slice in the text box
and clicking on the “Query for manifest” button.
When you notice status of all the nodes as active, switch to the controller's terminal and you should be
able to see logs similar to the ones in the below screen shot.

Figure(7)
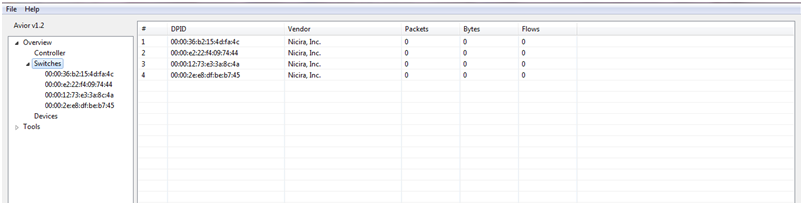
3.1.1 Mapping Nodes to their DPIDs
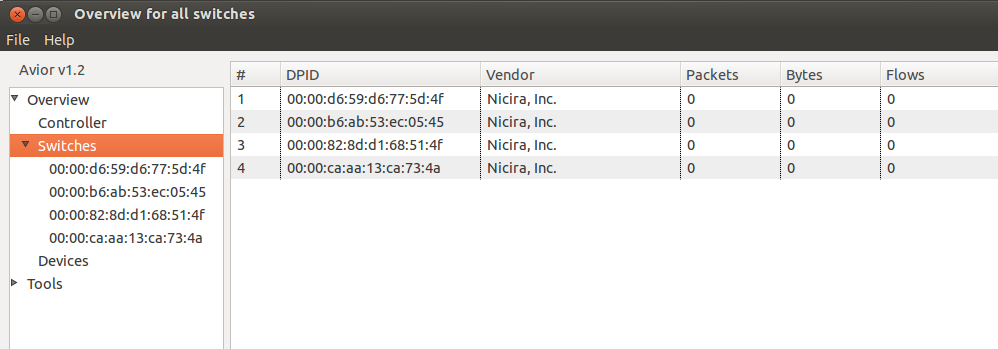
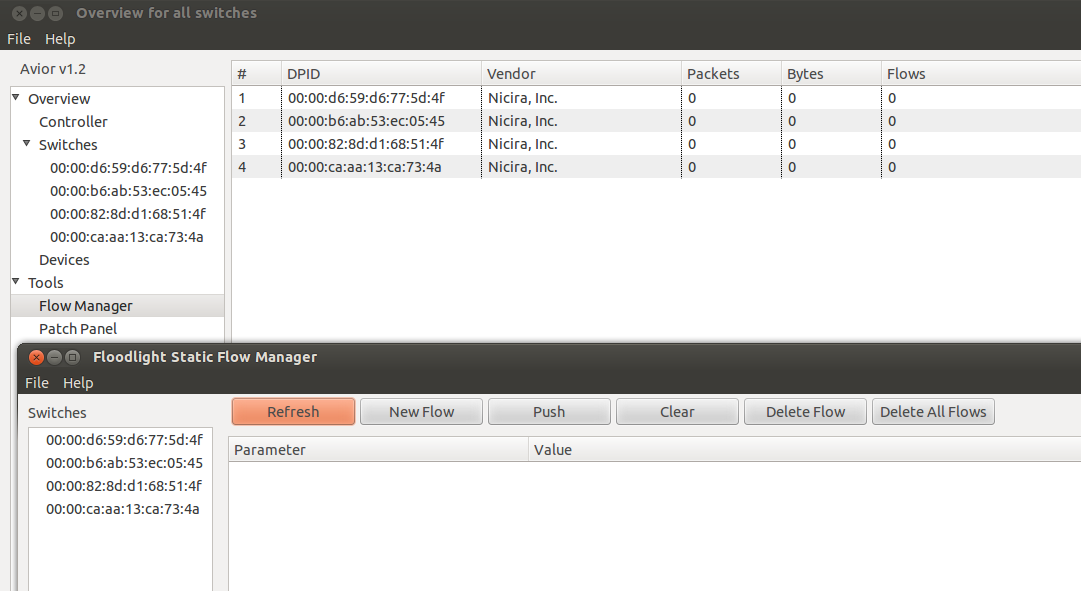
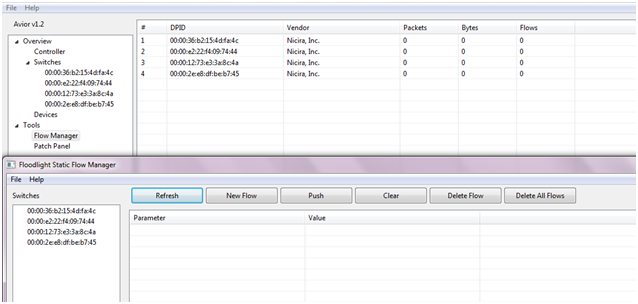
Now, switch over to the Avior’s control panel. You should be able to see four switches listed along with
their DPIDs'.

Figure(8)
Since we cannot modify DPIDs to a more readable format, we need to manually map the nodes to their
DPIDs. To do that, we need to login into each switch/node and type the below command.
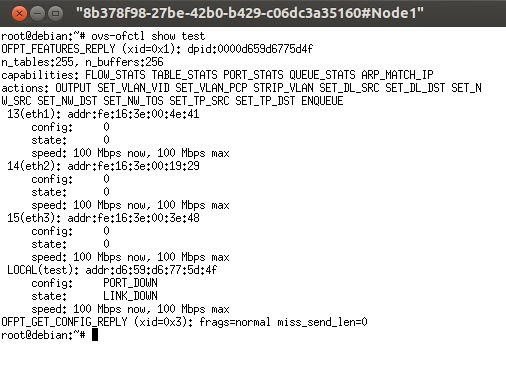
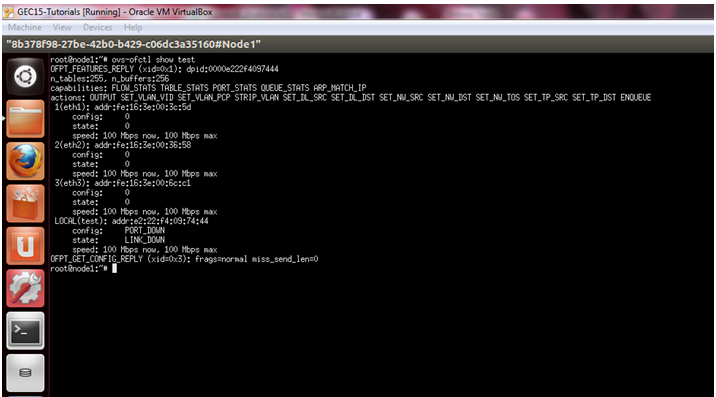
“ovs-ofctl show test”

Figure(9)
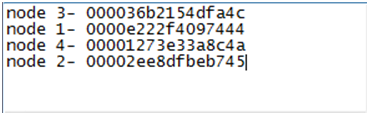
As you can see in the above screen shot, DPID is displayed in the first line of the output. Carefully map
each node/switch to its DPID so that you can follow the rest of tutorial with out any issues. Below
is the mapping used while writing this tutorial.

Figure(10)
The following figure shows an example configuration of the ExoGENI slice. Note: The IP addresses and the interface names will always be as shown in Figure 11 but the OpenFlow (OF) ports are assigned dynamically and can be different in the case of your specific slice! This video explains how the OF port numbers can be determined.

Figure(11)
3.1.2 Configure static ARP entries on the hosts
To make our life easier we are going to configure static ARP entries on both the hosts. If you plan to
move forward without configuring static ARP entries then you need to install flow rules specific to
ARP packets, which will double the work. [FYI: we have disabled learning switch on the controller as
well as in OVS]. You can configure static ARP entries using the command “arp -s <ip> <mac>”. For
example: "arp -s 192.168.2.6 fe:16:3e:00:57:b3 -i eth1” is used to specify that host with IP address
“192.168.2.6” and MAC address “fe:16:3e:00:57:b3” can be reached via interface eth1.
Similarly, configure the static ARP entry on the other host (node 5).
3.1.3 Configure flows
In this experiment, we are going to route the ICMP request packets from the node0 via “node1 →
node3 → node5” path and ICMP replies from node5 along the path “node3 → node4 → node2 →
node1 → node0”. To do that, we need to know the Openflow port numbers of interfaces on each
switch.
One way to find out is to use the command “ovs-ofctl show test” on each switch (refer to figure[9]) and
make a note of them.
To configure a flow, switch to Avior's control panel [do not panic if it gets struck while you are in
middle of something. Restart it and start over from the beginning] and click on the drop down arrow
beside tools. You will be able to find “flow manager” option. Switch to the flow manager window and select the switch [using the mapping created] to inset a flow entry and then click on new flow.

Figure(12)
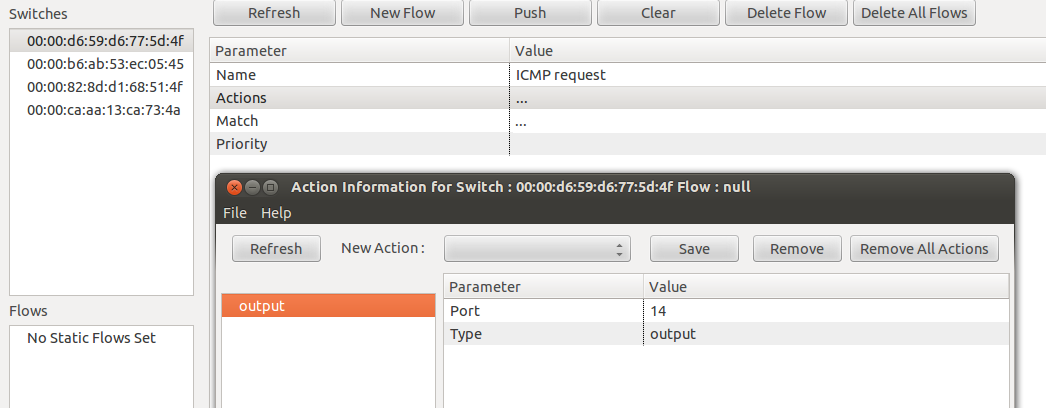
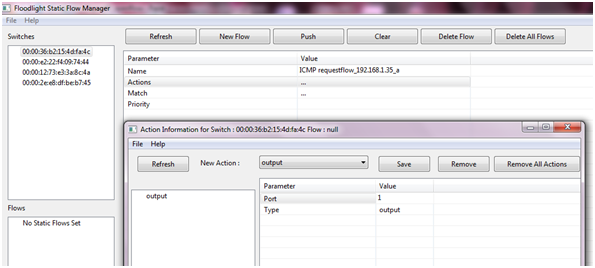
As you can see in the screen shot below, you will be asked to configure four fields. First, enter a name
for the flow, say “ICMP request flow_<dest ip>”. Next, click on actions and select output from the drop
down box and enter the port number [look into mapping between the interfaces and ports] you want the
packet to exit the switch from and click on save.

Figure (13)

Figure (14)
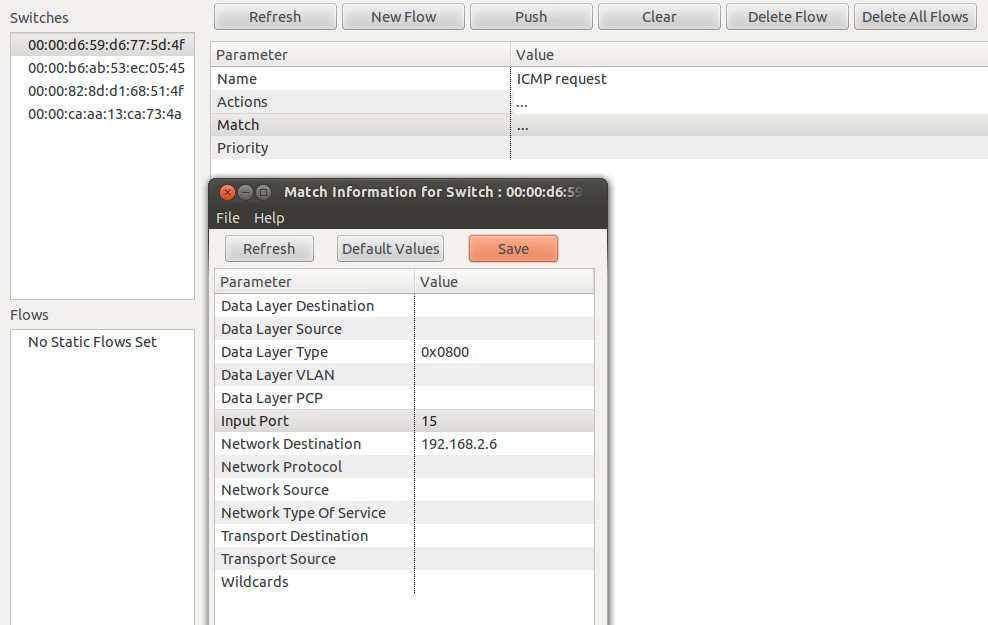
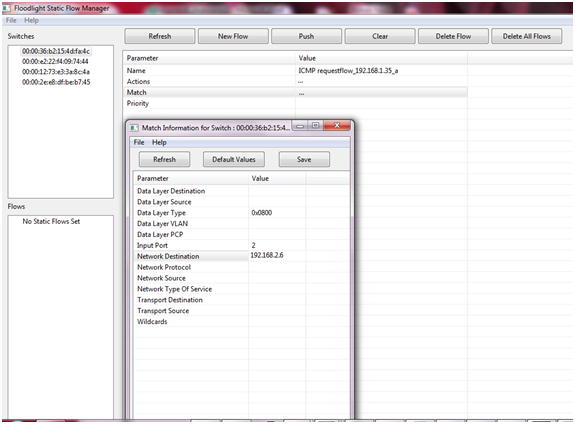
Now, click on match option and enter appropriate values for different fields as show in Figure [13].
Ensure that you enter the right input port value and also data layer type.
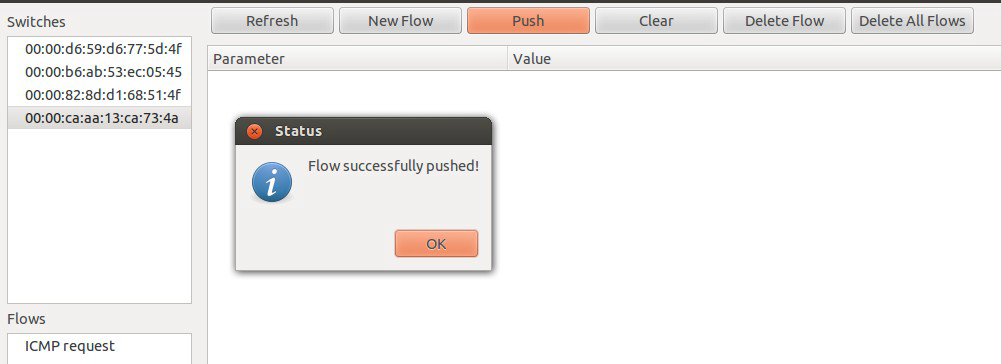
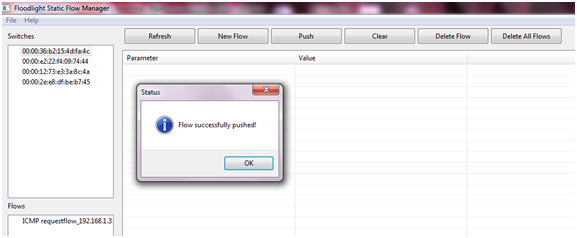
Lastly, save the match information and click on push. You should get a status message indicating
that your flow was pushed successfully.

Figure(15)
Carefully follow the same procedure and insert flows accordingly in all the switches. The procedure is
same for both ICMP requests as well as ICMP replies. All you need to do is type in the right input port and
output port values and the destination IP.
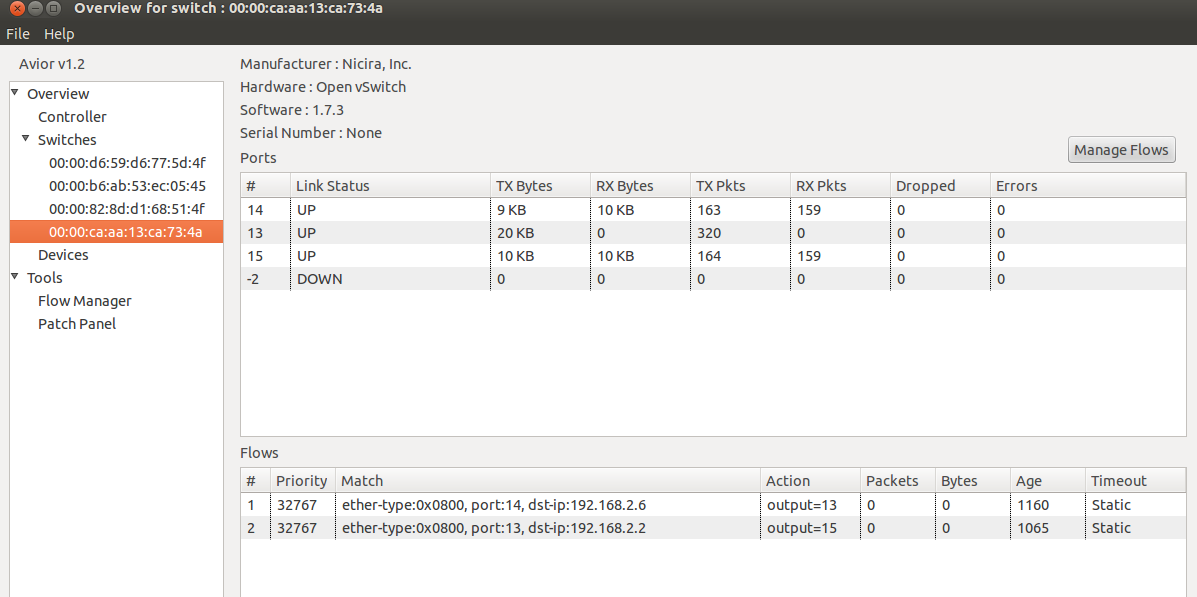
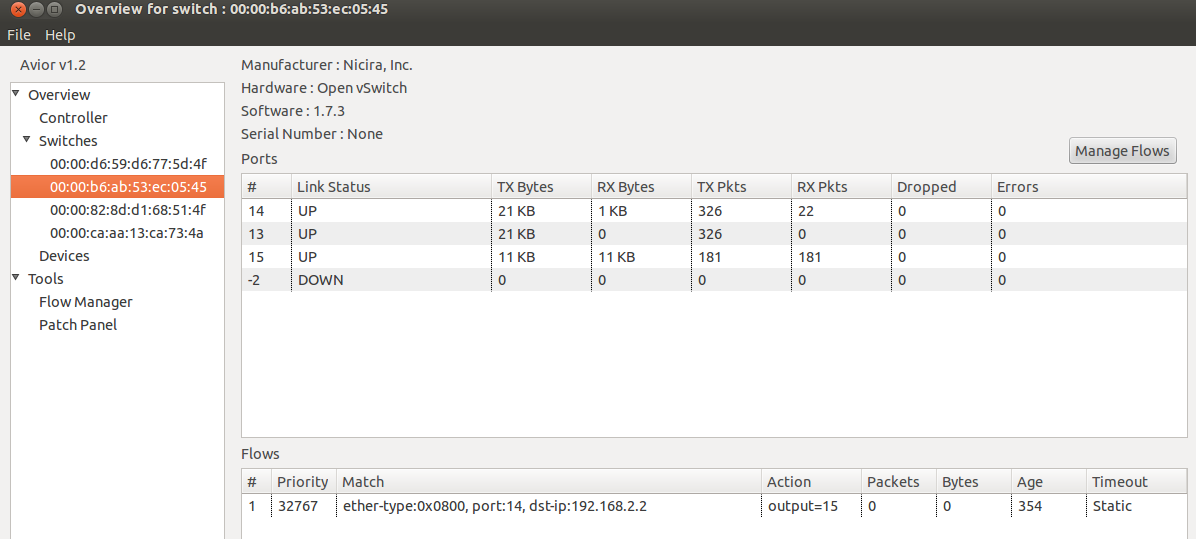
After you have configured all the four switches, nodes 1 & 3 should end up with two flow entries and
the other two switches [2 & 4] with one entry each. Verify your flow entries with the entries shown in
the below screen shots.

Figure(16): node1 flow entries

Figure(17): node3 flow entries

Figure(18): node4 flow entries

Figure(19): node2 flow entries
3.1.4 Run experiment - The PING test
After verifying all the flow entries, start sending ping packets from node0 to node5. Ensure that ping
packets originate from the right interface i.e. the source IP should be 192.168.2.2. One way to do that
is using the -I option of ping command. For example: if interface eth1 is configured with IP
“192.168.2.2” then we need to use the command “ping 192.168.2.6 -I eth1” for the ping to pass.
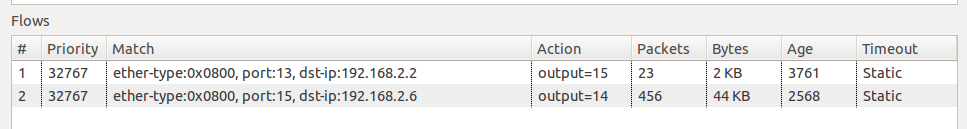
In case you don't see any ping replies then you can debug the packet path using packet counters, which
indicate whether packets were hitting the TCAM entry [see the “packets column of the flow entry in the
above screen shot”]. If the counter doesn't increment then cross check the flow entry on that switch as
well as the flow entries on other switches to ensure that packets are being forwarded on the right path.
You can also use “tcpdump” tool to monitor packets on an interface. Moreover, OVS provides a
way to monitor packets being forwarded by a switch using “ovs-vsctl snoop <bridge name>”
command. [replace bridge name with test for this experiment].
Now, that we have successfully completed the ping test. Lets try to break it. There are many ways to do
it. One can delete one of the flow entries or remove the static ARP entries on one of the hosts. Lets do
the later one by removing the ARP entry on node5 using the command “arp -d 192.168.2.2”. Now, the
packet counters increase along the flow path “node1 → node3 → node5” and remain constant along the
flow path “node5 → node3 → node4 → node2 → node1 → node0”.


Figure(20): Flow entries on node 1
I hope you found the tutorial useful. Keep experimenting with different topologies and configurations.
Attachments (30)
- Figure2_openflow.png (209.6 KB) - added by 11 years ago.
- Figure3_openflow.png (164.9 KB) - added by 11 years ago.
- Figure4_openflow.png (62.8 KB) - added by 11 years ago.
- Figure6_openflow.png (24.4 KB) - added by 11 years ago.
- Figure7_openflow.png (256.0 KB) - added by 11 years ago.
- Figure8_openflow.png (34.4 KB) - added by 11 years ago.
- Figure9_openflow.png (20.8 KB) - added by 11 years ago.
- Figure10_openflow.png (4.5 KB) - added by 11 years ago.
- Figure11_openflow.png (61.6 KB) - added by 11 years ago.
- Figure12_openflow.png (47.4 KB) - added by 11 years ago.
- Figure13_openflow.png (255.3 KB) - added by 11 years ago.
- Figure14_openflow.png (104.1 KB) - added by 11 years ago.
- Figure15_openflow.png (64.9 KB) - added by 11 years ago.
- Figure16_openflow.png (64.0 KB) - added by 11 years ago.
- Figure18_openflow.png (52.8 KB) - added by 11 years ago.
- Figure19a_openflow.png (17.1 KB) - added by 11 years ago.
- Figure19b_openflow.png (16.6 KB) - added by 11 years ago.
- Figure17_openflow.png (58.8 KB) - added by 11 years ago.
- Figure1_new_openflow.png (67.3 KB) - added by 11 years ago.
- Figure5_new_openflow.png (45.6 KB) - added by 11 years ago.
- Figure8c_openflow.png (27.4 KB) - added by 11 years ago.
- Figure8d_openflow.png (22.2 KB) - added by 11 years ago.
- Figure8e_openflow.png (54.9 KB) - added by 11 years ago.
- Figure8g_openflow.png (66.8 KB) - added by 11 years ago.
- Figure8h_openflow.png (81.2 KB) - added by 11 years ago.
- Figure8i_openflow.png (49.9 KB) - added by 11 years ago.
- Figure8a_openflow.2.png (103.8 KB) - added by 11 years ago.
- OF-topo.png (86.0 KB) - added by 11 years ago.
- Figure2a_openflow.png (240.7 KB) - added by 11 years ago.
-
GIMI GEC 16 I&M Tutorial.pptx (526.1 KB) - added by 11 years ago.
Slides for GIMI tutorial