
| Version 27 (modified by , 11 years ago) (diff) |
|---|
EG-MON-4: Infrastructure Device Performance Test
This page captures status for the test case EG-MON-4, which verifies that the rack head node performs well enough to run all the services it needs to run while OpenFlow and non-OpenFlow experiments are running. For overall status see the ExoGENI Acceptance Test Status page.
Last update: 2013/01/31
Test Status
This section captures the status for each step in the acceptance test plan.
| Step | State | Notes |
| Step 1 | Color(green,Pass)? | |
| Step 2 | Color(green,Pass)? | |
| Step 3 | Color(green,Pass)? |
| State Legend | Description |
| Color(green,Pass)? | Test completed and met all criteria |
| Color(#98FB98,Pass: most criteria)? | Test completed and met most criteria. Exceptions documented |
| Color(red,Fail)? | Test completed and failed to meet criteria. |
| Color(yellow,Complete)? | Test completed but will require re-execution due to expected changes |
| Color(orange,Blocked)? | Blocked by ticketed issue(s). |
| Color(#63B8FF,In Progress)? | Currently under test. |
Test Plan Steps
This test cases sets up several experiments to generate resource usage for both compute and network resources in an InstaGENI Rack. The rack used is the GPO rack and the following experiments are set up before head node device performance is reviewed:
- EG-MON-4-exp1: EG GPO non-OpenFlow experiment with 10 VM nodes, all nodes exchanging traffic.
- EG-MON-4-exp2: EG GPO non-OpenFlow experiment with 1 VM and one bare metal node, both exchanging traffic.
- EG-MON-4-exp3: EG GPO OpenFlow experiment with 2 nodes in rack exchanging traffic with 2 site GPO OpenFlow campus resources.
- EG-MON-4-exp4: EG GPO OpenFlow experiment with 4 nodes exchanging traffic within the GPO rack using OpenFlow.
The setup of the experiments above is not captured in this test case, but the RSpec are available [insert_link_here]. Also traffic levels and types will be captured when this test is run.
1. View OpenFlow control monitoring at GMOC and verify that no monitoring data is missing
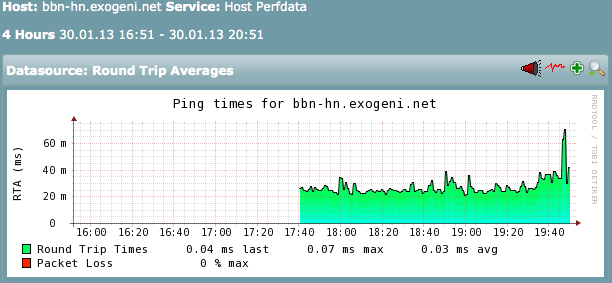
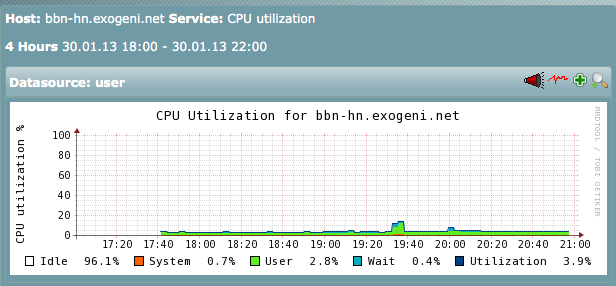
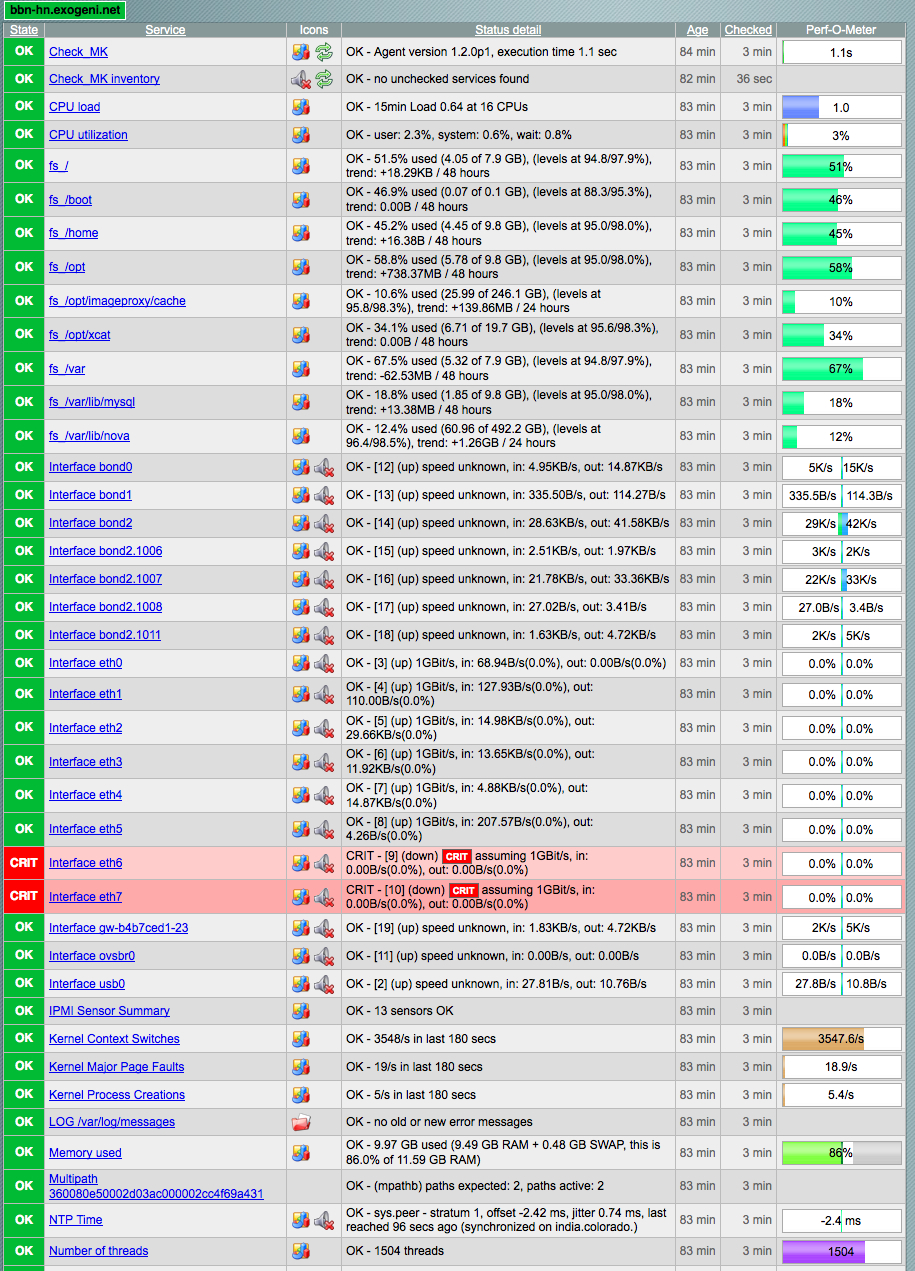
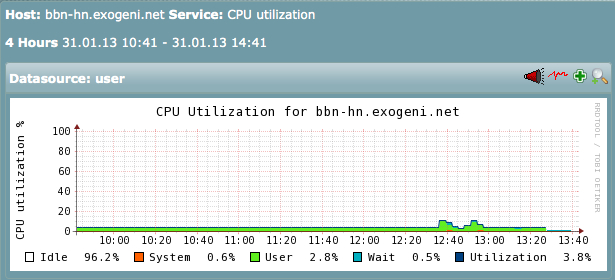
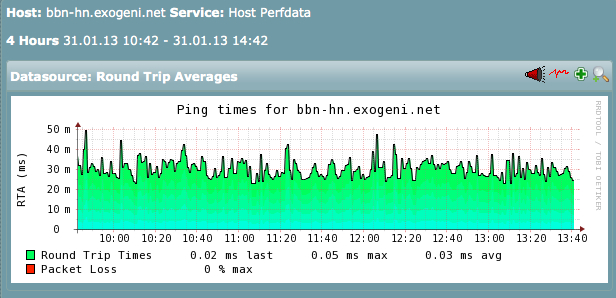
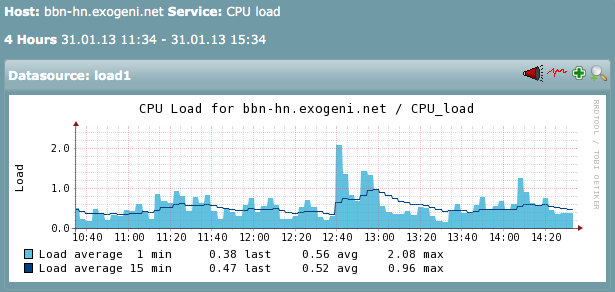
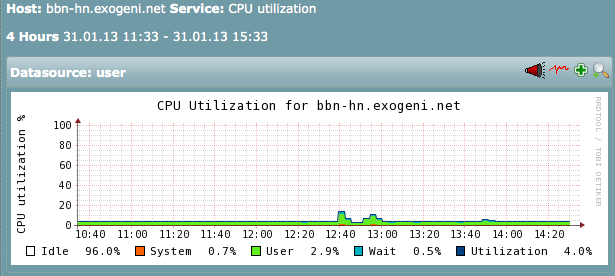
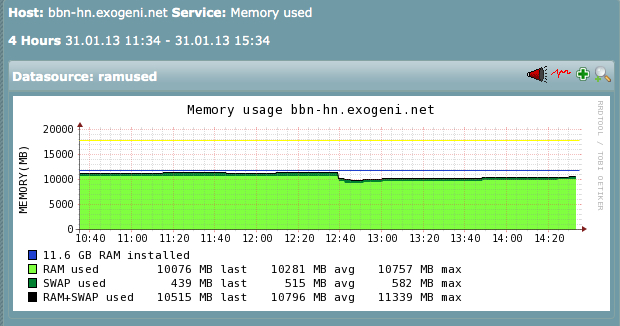
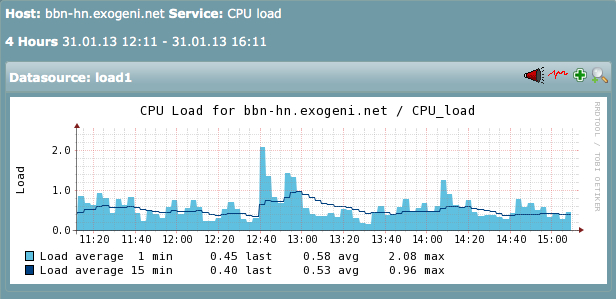
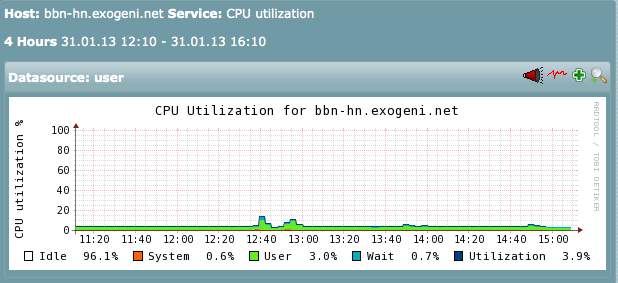
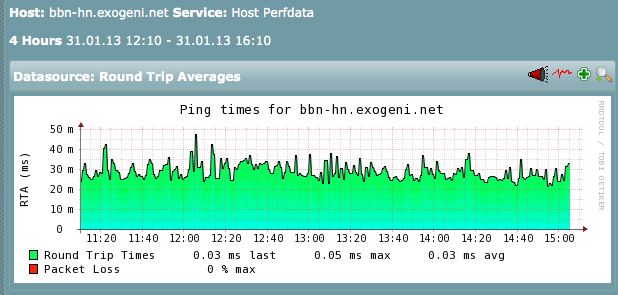
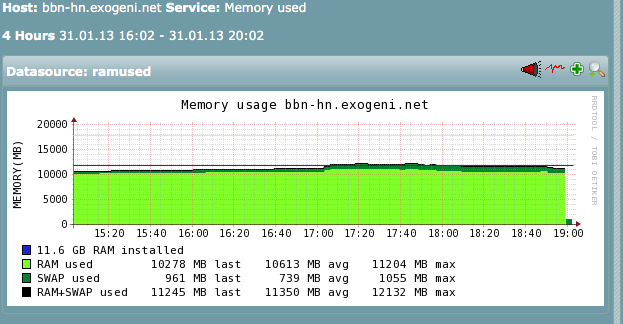
Before starting any experiments that request compute or network resources, collected information for baseline performance for the GPO rack head node at https://bbn-hn.exogeni.net/rack_bbn/check_mk/. Here are performance measurements for the node:

Checked Round Trip Averages:

Checked CPU Utilization:

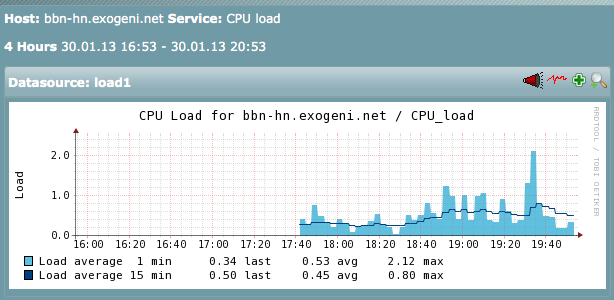
Checked CPU Load:

Checked Memory Used:

At the time of these measurements, three foam slivers were in place and 57 FlowVisor rule entries:
   [lnevers@bbn-hn ~]$ foamctl geni:list-slivers --passwd-file=/opt/foam/etc/foampasswd|grep sliver_urn
   "sliver_urn": "urn:publicid:IDN+pgeni.gpolab.bbn.com+slice+jbs15:013f6aa7-e600-4be5-9e31-5c0436223dfd",
   "sliver_urn": "urn:publicid:IDN+pgeni.gpolab.bbn.com+slice+jbs16:8aad0aae-ae92-4a3c-bd5e-43f7456f628e",
   "sliver_urn": "urn:publicid:IDN+pgeni.gpolab.bbn.com+slice+tuptymon:a512fb29-d04f-4223-9a34-ae38158be609",
   [lnevers@bbn-hn ~]$ /opt/flowvisor/bin/fvctl --passwd-file=/opt/flowvisor/etc/flowvisor/fvpasswd listFlowSpace |grep rule |wc -l
     57
Also according to list resources there are 43 VM available via GPO SM:
      <node component_id="urn:publicid:IDN+exogeni.net:bbnvmsite+node+orca-vm-cloud"
       component_manager_id="urn:publicid:IDN+exogeni.net:bbnvmsite+authority+am"
       component_name="orca-vm-cloud" exclusive="false">
            <hardware_type name="orca-vm-cloud">
                  <ns3:node_type type_slots="43"/>
            </hardware_type>
and 25 VMs available via the ExoSM and 1 Bare Metal:
      <node component_id="urn:publicid:IDN+exogeni.net:bbnvmsite+node+orca-vm-cloud"
      component_manager_id="urn:publicid:IDN+exogeni.net:bbnvmsite+authority+am"
      component_name="orca-vm-cloud" exclusive="false">
            <hardware_type name="orca-vm-cloud">
                  <ns3:node_type type_slots="25"/>
            </hardware_type>
            <available now="true"/>

      <node component_id="urn:publicid:IDN+exogeni.net:bbnvmsite+node+orca-xcat-cloud" component_manager_id="urn:publicid:IDN+exogeni.net:bbnvmsite+authority+am" component_name="orca-xcat-cloud" exclusive="false">
            <hardware_type name="orca-xcat-cloud">
                  <ns3:node_type type_slots="1"/>
            </hardware_type>
Set up the first experiment EG-MON-4-exp1 at the GPO SM. Experiment included 10 VM nodes exchanging traffic, without OpenFlow. Verified all nodes in the sliver were ready, and started a ping on each of the ten nodes to another node in the sliver using 64 bytes packets with an interval of 3 packet/sec. After 20 minutes, checked statistics for:
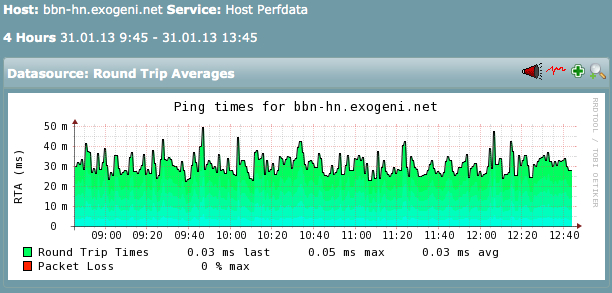
Checked Round Trip Averages:

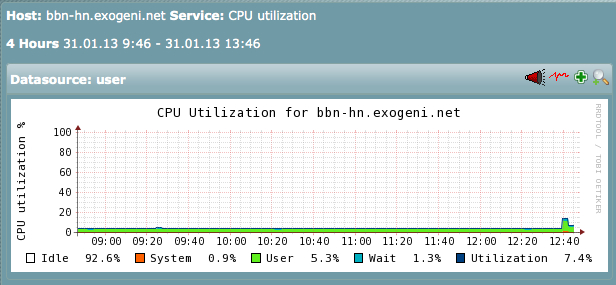
Checked CPU Utilization:

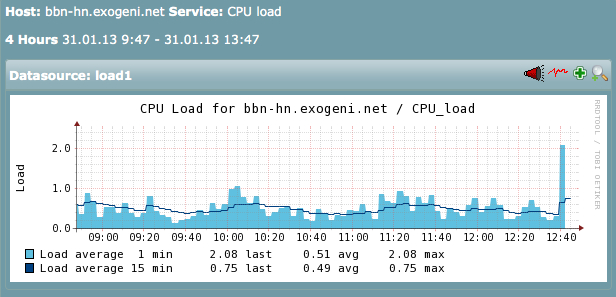
Checked CPU Load:

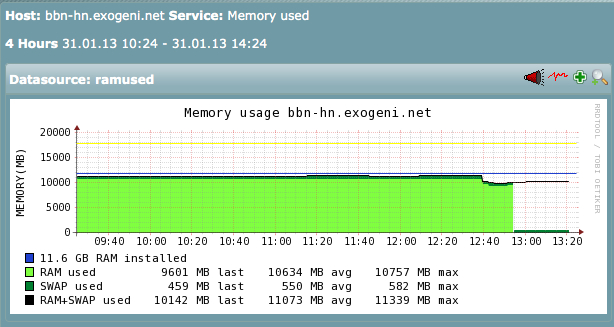
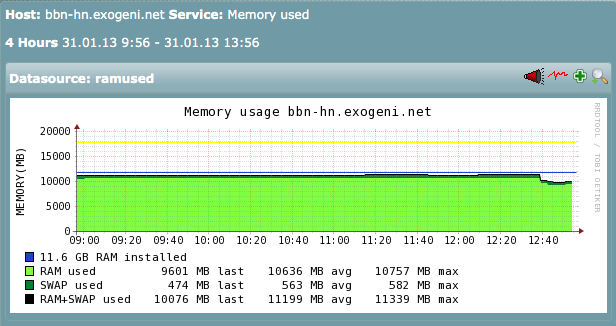
Check Memory:

Left previous EG-MON-exp1 running and set up the second experiment EG-MON-4-exp2 at the ExoSM for the GPO site. Experiment included 1 bare metal and 1 VM, without OpenFlow. Verified all nodes in the sliver were ready, and started continuous Iperf traffic between the two nodes, traffic ran for 20 minutes and then checked statistics:
Checked Round Trip Averages:

Checked CPU Utilization:

Checked CPU Load:

Check Memory:

The results from the 20 minutes iperf from bare metal to VM in EG-MON-exp2:
[root@BT ~]# iperf -c 172.16.1.2 -t 1200
------------------------------------------------------------
Client connecting to 172.16.1.2, TCP port 5001
TCP window size: 23.2 KByte (default)
------------------------------------------------------------
[  3] local 172.16.1.1 port 53398 connected with 172.16.1.2 port 5001
[ ID] Interval       Transfer     Bandwidth
[  3]  0.0-1200.0 sec    442 GBytes  3.16 Gbits/sec
Before proceeding to the next experiment, started continuous pings with 1400 and 1500 bytes packets @ 3pps between the VM and bare metal nodes.
2. View VLAN 1750 data plane monitoring
Started EG-MON-3-exp3 which uses OpenFlow to connect two nodes in the rack with 2 campus nodes. Once the FOAM and Compute Resource slivers were ready logged into the Shared VLAN hosts and campus hosts and started the following ping traffic:
- VM-1 ping tiberium
- VM-2 ping siovale
- siovale ping VM-2
- tiberium ping VM-1
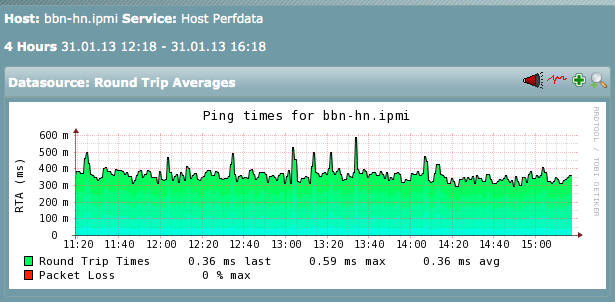
Checked Round Trip Averages:

Checked CPU Utilization:

Checked CPU Load:

Check Memory:

Verify the VLAN 1750 data plane monitoring which pings the rack's interface on VLAN 1750, and verify that packets are not being dropped Checked statistics for the Control Network management interface:

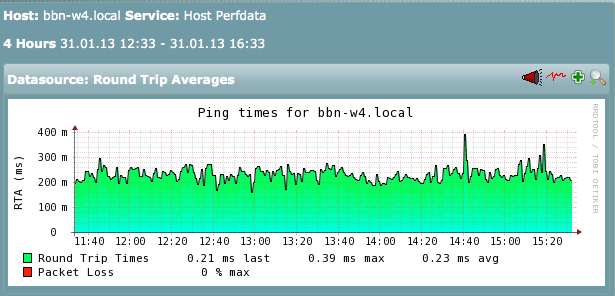
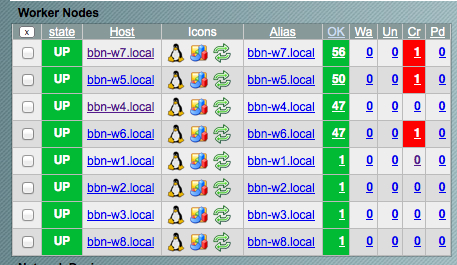
Checked for worker nodes by activity:

Note: "Cr" is critical action needed to install updates, not relevant to this test, thus ignored.
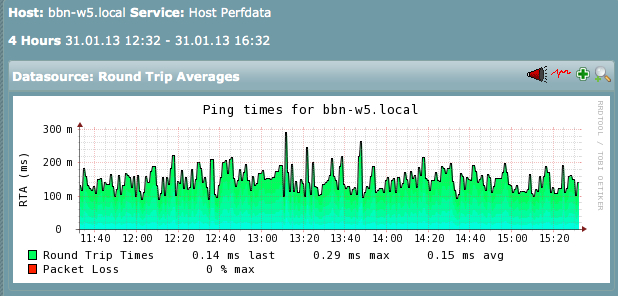
Reviewed ping statistics for node bbn-w5.local:

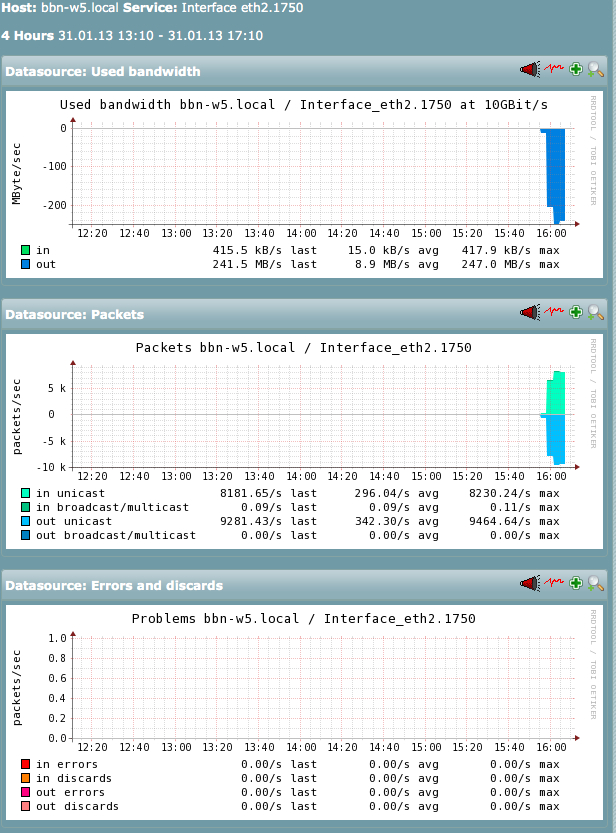
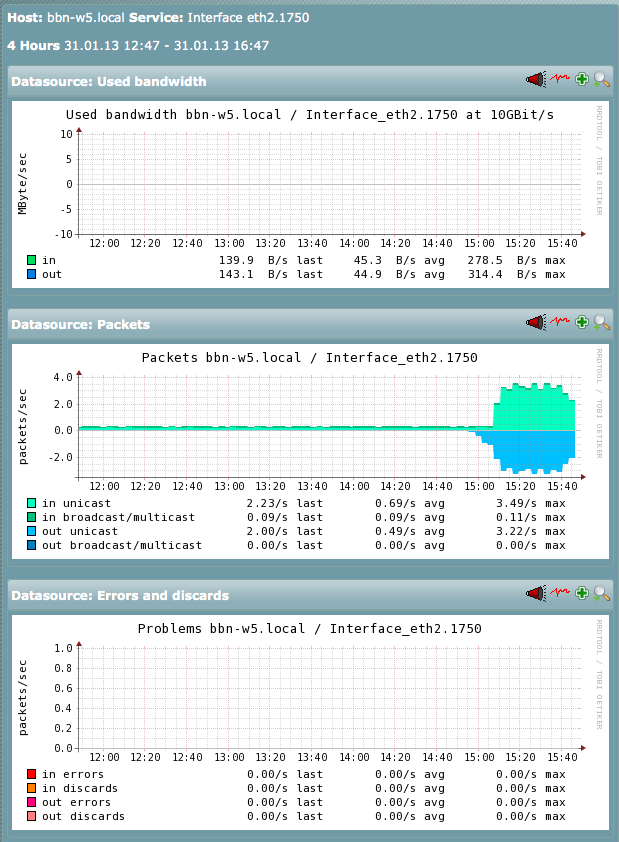
Checked eth2.1750 statistics for OF VLAN on node bbn-w5, found no drops:

Kept pings running and added Iperf from VM-1, siovale & tiberiun to VM-2 for 10 minutes and recaptured eth2.1750 statistics:

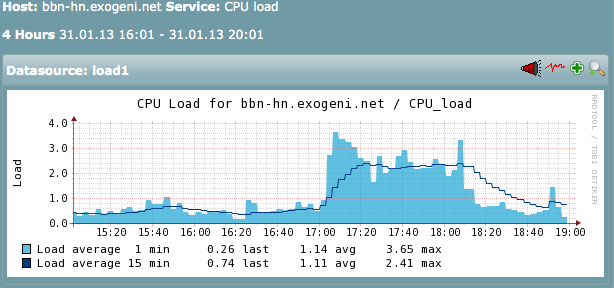
3. Verify that the CPU idle percentage on the head node is nonzero
The CPU Idle percentage after the completion of EG-MON-exp3:
[lnevers@bbn-hn ~]$  mpstat -P ALL
Linux 2.6.32-279.11.1.el6.x86_64 (bbn-hn.exogeni.net) 	01/31/2013 	_x86_64_	(16 CPU)

04:16:20 PM  CPU    %usr   %nice    %sys %iowait    %irq   %soft  %steal  %guest   %idle
04:16:20 PM  all    1.60    0.01    0.39    0.37    0.00    0.02    0.00    0.00   97.61
04:16:20 PM    0    1.93    0.01    0.51    2.01    0.00    0.03    0.00    0.00   95.51
04:16:20 PM    1    1.66    0.00    0.35    0.06    0.00    0.02    0.00    0.00   97.89
04:16:20 PM    2    1.64    0.01    0.30    0.05    0.00    0.02    0.00    0.00   98.00
04:16:20 PM    3    1.31    0.01    0.29    0.03    0.00    0.01    0.00    0.00   98.35
04:16:20 PM    4    2.08    0.02    0.54    2.63    0.00    0.03    0.00    0.00   94.70
04:16:20 PM    5    1.37    0.01    0.33    0.08    0.00    0.02    0.00    0.00   98.20
04:16:20 PM    6    0.82    0.01    0.24    0.04    0.00    0.01    0.00    0.00   98.89
04:16:20 PM    7    1.07    0.01    0.23    0.04    0.00    0.03    0.00    0.00   98.62
04:16:20 PM    8    3.00    0.00    0.29    0.24    0.00    0.03    0.00    0.00   96.43
04:16:20 PM    9    3.68    0.04    0.75    0.05    0.00    0.03    0.00    0.00   95.46
04:16:20 PM   10    1.30    0.01    0.41    0.05    0.00    0.01    0.00    0.00   98.21
04:16:20 PM   11    0.96    0.01    0.28    0.04    0.00    0.01    0.00    0.00   98.70
04:16:20 PM   12    1.37    0.00    0.37    0.42    0.00    0.07    0.00    0.00   97.76
04:16:20 PM   13    1.89    0.06    0.78    0.06    0.00    0.01    0.00    0.00   97.20
04:16:20 PM   14    0.79    0.02    0.37    0.05    0.00    0.01    0.00    0.00   98.76
04:16:20 PM   15    0.67    0.01    0.24    0.03    0.00    0.01    0.00    0.00   99.04
Added EG-MON-4-exp4 which allocated 4 nodes in the GPO rack using OpenFlow. Verify connectivity between the nodes and on VLAN 1750 and started iperf traffic between nodes in the two OpenFlow Experiments. Overall, 7 clients on one iperf server (VM-2 EG-MON-4-exp3). Taffic ran for 10 minutes with one thread for each client and 10 additional minutes with 5 threads for each client host.
No packet drops were seen.
Additional tests
With the above experiments in place, ran an additional test that executed 10 sliver creation and 10 deletion for EG-MON-4-exp1 (10 VMs on 1 lan). Once completed, stopped all experiments and checked statistics to make sure that resources are released.
Checked Round Trip Averages:

Checked CPU Utilization:

Checked CPU Load:

Check Memory:

Attachments (35)
- EG-MON-5-bbn-hn-cpu.jpg (1.5 MB) - added by 11 years ago.
- EG-MON-5-ping-exp1.jpg (175.8 KB) - added by 11 years ago.
- EG-MON-5-cpu-load-exp1.jpg (171.3 KB) - added by 11 years ago.
- EG-MON-5-bbn-hn-cpu-load.jpg (170.2 KB) - added by 11 years ago.
- EG-MON-5-cpu.jpg (177.8 KB) - added by 11 years ago.
- EG-MON-5-ping.jpg (197.7 KB) - added by 11 years ago.
- EG-MON-4-memory-exp1.jpg (209.2 KB) - added by 11 years ago.
- EG-MON-4-memory.jpg (208.5 KB) - added by 11 years ago.
- EG-MON-4-bbn-hn-cpu-load.jpg (170.2 KB) - added by 11 years ago.
- EG-MON-4-cpu.jpg (177.8 KB) - added by 11 years ago.
- EG-MON-4-ping.jpg (197.7 KB) - added by 11 years ago.
- EG-MON-4-cpu-exp1.jpg (163.0 KB) - added by 11 years ago.
- EG-MON-4-bbn-hn-cpu.jpg (1.5 MB) - added by 11 years ago.
- EG-MON-4-cpu-load-exp1.jpg (182.3 KB) - added by 11 years ago.
- EG-MON-4-cpu-util-exp1.jpg (178.3 KB) - added by 11 years ago.
- EG-MON-4-ping-exp1.jpg (209.4 KB) - added by 11 years ago.
- EG-MON-4-cpu-load-exp2.jpg (171.3 KB) - added by 11 years ago.
- EG-MON-4-cpu-util-exp2.jpg (176.3 KB) - added by 11 years ago.
- EG-MON-4-memory-exp2.jpg (208.2 KB) - added by 11 years ago.
- EG-MON-4-ping-exp2.jpg (196.3 KB) - added by 11 years ago.
- EG-MON-4-cpu-load-exp3.jpg (182.7 KB) - added by 11 years ago.
- EG-MON-4-cpu-util-exp3.jpg (181.0 KB) - added by 11 years ago.
- EG-MON-4-memory-exp3.jpg (200.4 KB) - added by 11 years ago.
- EG-MON-4-ping-ctl-exp3.jpg (199.9 KB) - added by 11 years ago.
- EG-MON-4-ping-exp3.jpg (208.0 KB) - added by 11 years ago.
- IG-MON-4-bbn-w4.jpg (207.3 KB) - added by 11 years ago.
- IG-MON-4-bbn-w5-vlan1750-10min.jpg (471.7 KB) - added by 11 years ago.
- IG-MON-4-bbn-w5-vlan1750.jpg (488.8 KB) - added by 11 years ago.
- IG-MON-4-bbn-w5.jpg (204.2 KB) - added by 11 years ago.
- IG-MON-4-bbn-w7.jpg (201.4 KB) - added by 11 years ago.
- IG-MON-4-workers.jpg (203.7 KB) - added by 11 years ago.
- EG-MON-4-cpu-load-final.jpg (185.0 KB) - added by 11 years ago.
- EG-MON-4-cpu-util-final.jpg (182.9 KB) - added by 11 years ago.
- EG-MON-4-memory-final.jpg (211.6 KB) - added by 11 years ago.
- EG-MON-4-ping-final.jpg (175.0 KB) - added by 11 years ago.