
| Version 8 (modified by , 8 years ago) (diff) |
|---|
GENI Monitoring Tips
This page highlights how to use GENI Monitoring features to investigate GENI Operations issues. All procedures assume that GENI Monitoring user is logged into the GENI Monitoring System.
Slice Topology and Bandwidth Usage
This scenario shows how to map a slice name to its topology (nodes and links) and to the bandwidth usage for each site in the slice. This sections shows how to determine the topology for a slice named "triangle" and then shows usage for one of the sites in this experiment.
- In the left-hand navigation bar, type
"triangle"inSearchbox. This will show matching any item in monitoring containing the string"triangle"in the main panel.
- In the
Sliceslisting select the slice ID"ch.geni.net_ln-test_slice_triangle". This will show all slice details in the main panel including:- Map tab - A resource allocation map, not the actual topology of the slice.
- Active Members tab - The project owner of the the slice
- Slivers tab - The list of compute resource slivers and network slivers associated with the slice.
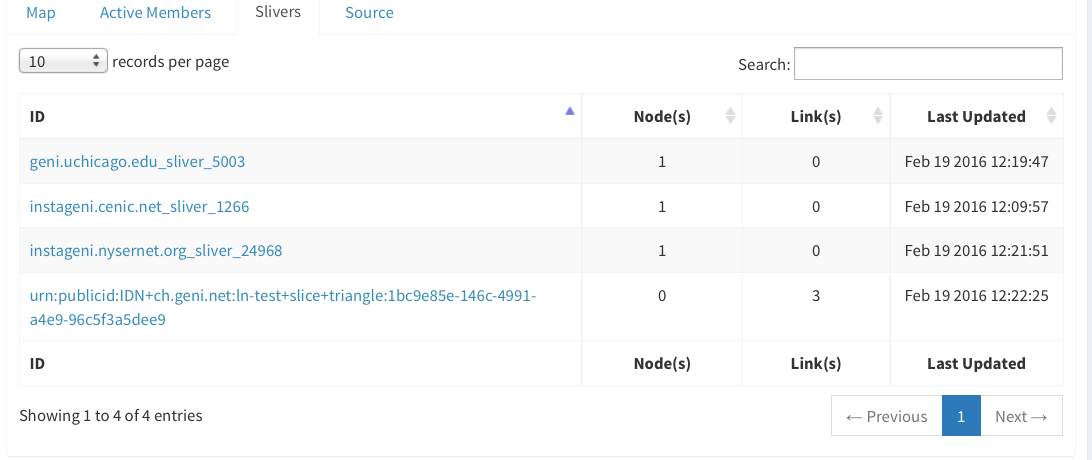
- For our triangle slice, the
Sliverstab will include a lists of 4 slivers (1 from AL2S and 3 from Rack Aggregates). From this list you can see that te slice has 3 nodes (1 at each site) and 3 links at AL2S, as shown below:

- You can select the each of the site slivers to determine which VM server or raw device the compute resource is allocated on. For example, selecting:
"geni.uchicago.edu_sliver_5003"shows that compute resource is on"geni.uchicago.edu_node_pcvm3-1""instageni.cenic.net_sliver_1266"shows that compute resource is on"instageni.cenic.net_node_pcvm2-2""instageni.nysernet.org_sliver_24968"shows that compute resource is on"instageni.nysernet.org_node_pcvm3-4"
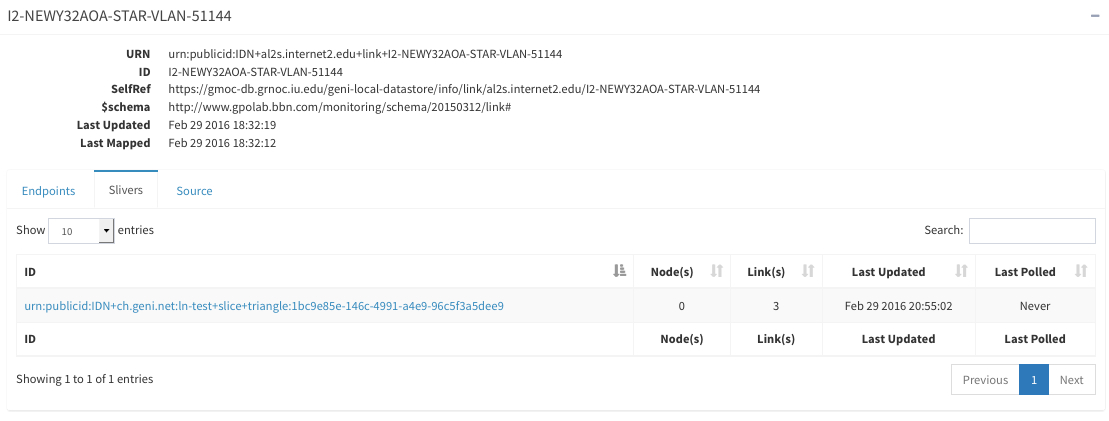
- You can determine the slice topology and the site usage statistics by using the VLANs IDs allocated to the slice. VLANs can be determined from the AL2S sliver details:
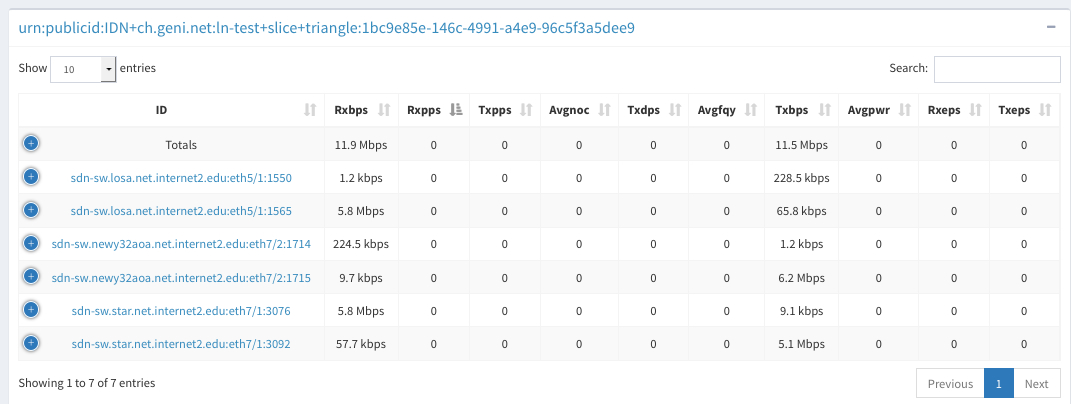
- Selected the AL2S sliver
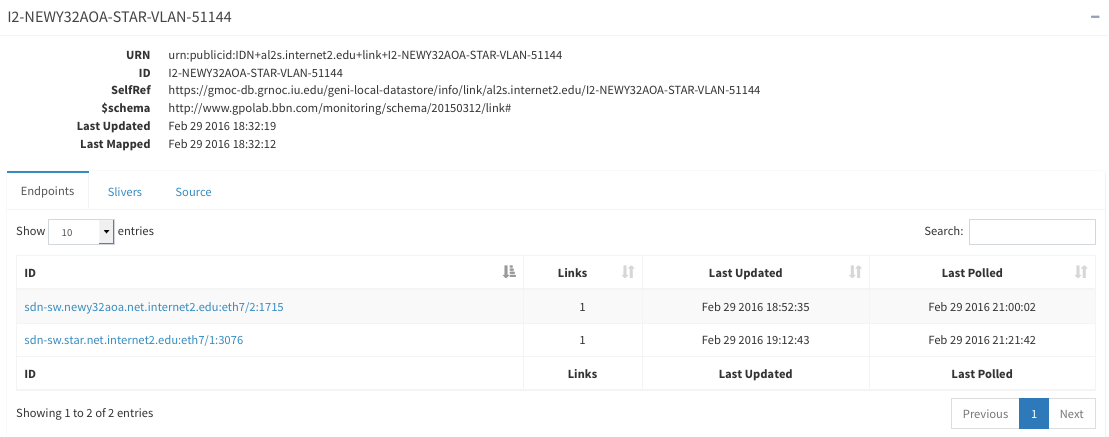
"urn:publicid:IDN+ch.geni.net:ln-test+slice+triangle:1bc9e85e-146c-4991-a4e9-96c5f3a5dee9"for the list of slivers for this slice. - Select each of the links that are part of the sliver to find VLANs allocated:
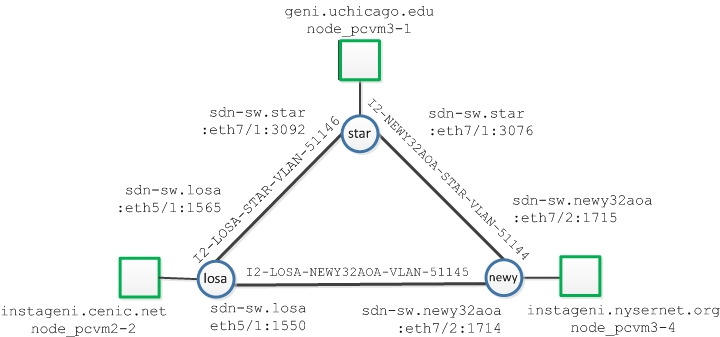
- I2-LOSA-NEWY32AOA-VLAN-51145 includes
sdn-sw.losa.net.internet2.edu:eth5/1:1550andsdn-sw.newy32aoa.net.internet2.edu:eth7/2:1714 - I2-LOSA-STAR-VLAN-51146 includes
sdn-sw.losa.net.internet2.edu:eth5/1:1565andsdn-sw.star.net.internet2.edu:eth7/1:3092 - I2-NEWY32AOA-STAR-VLAN-51144 includes
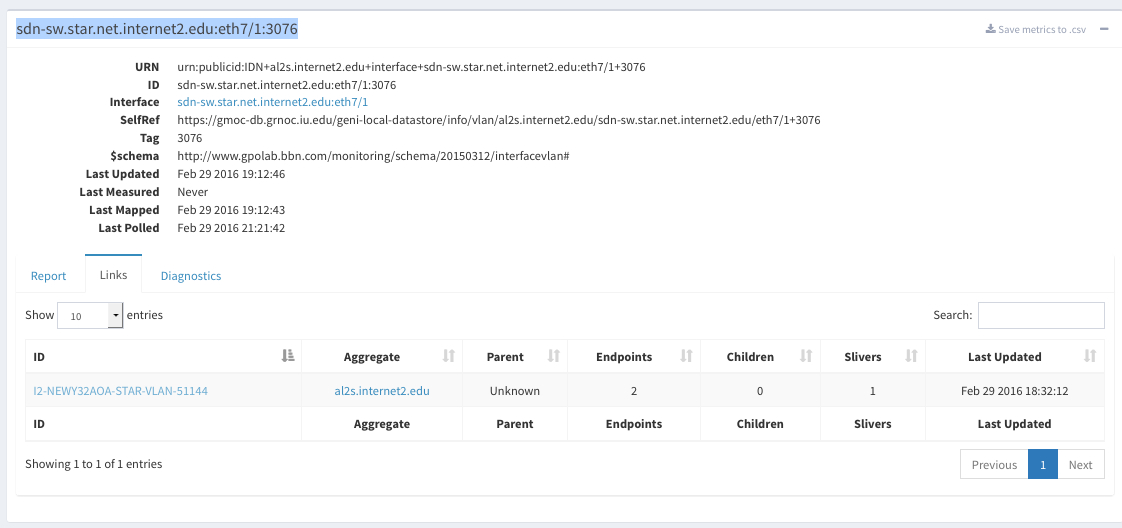
sdn-sw.newy32aoa.net.internet2.edu:eth7/2:1715andsdn-sw.star.net.internet2.edu:eth7/1:3076
- I2-LOSA-NEWY32AOA-VLAN-51145 includes
- Selected the AL2S sliver
NOTE: Steps 3, 4 and 5 provide information to determine the topology for the slice. Following is a diagram of the details reported from step 3, 4 and 5:

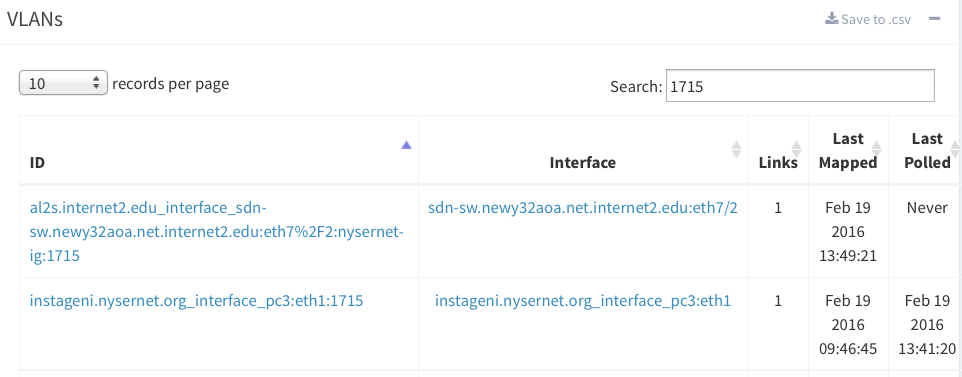
- Assuming we are interested in the bandwidth usage for the NYSERNet connections (sdn-sw.newy32aoa.net.internet2.edu), you can see from the previous step that there are two VLANs associated with the site (1714 and 1715).
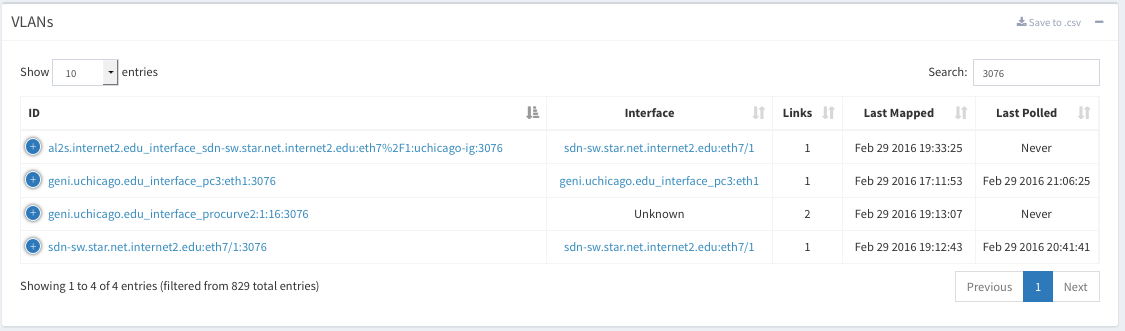
- Select Dashborad->VLANs, this will show the full list of VLAN in use in GENI. In the resulting VLAN listing type the VLAN ID
1715in the panel search to narrow the results to you sliver:

- Select the ID
instageni.nysernet.org_interface_pc3:eth1:1715to see usage statistics:

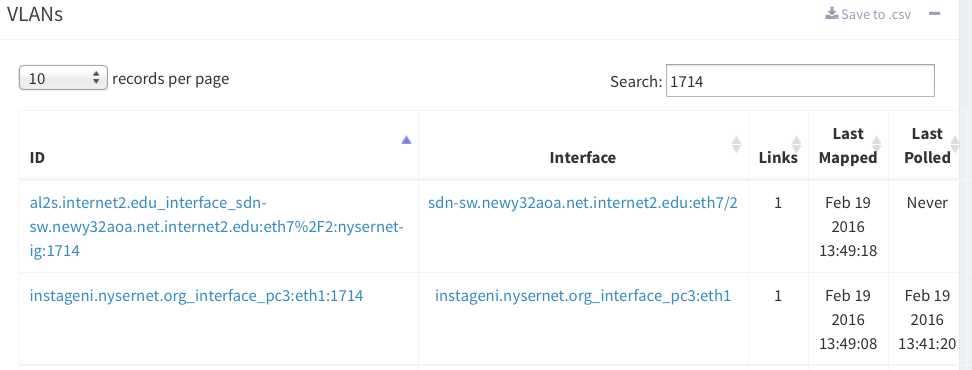
- For the seconds NYSERNet connection, select Dashborad->VLANs, this will show the full list of VLAN in use in GENI. In the resulting VLAN listing type the VLAN ID
1714in the panel search to narrow the results to you sliver:

- Select the ID
instageni.nysernet.org_interface_pc3:eth1:1714to see usage statistics:

Largest Traffic Source at an Aggregate
This scenario shows how to determine the slice that is generating the largest traffic amount at a site. This example assumes the site that is being investigated is Clemson.
- In
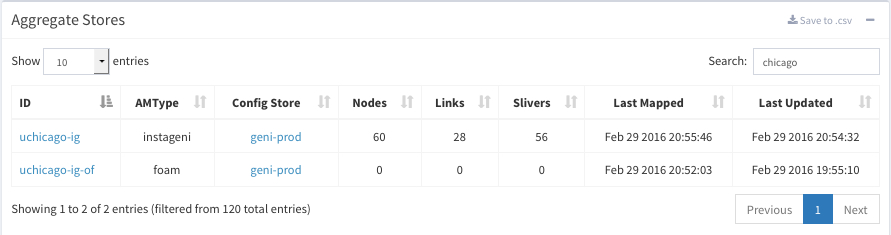
Dashboardclick on theAggregatesbutton, this will display all known aggregates.
- Narrow down the list by typing "clemson" in the upper-right
Searchfield, which will show only Clemson aggregates. As you can see from the Nodes and Slivers counts, the InstaGENI rack has the most activity and most likely the source of the issue. So will we focus on clemson-ig:

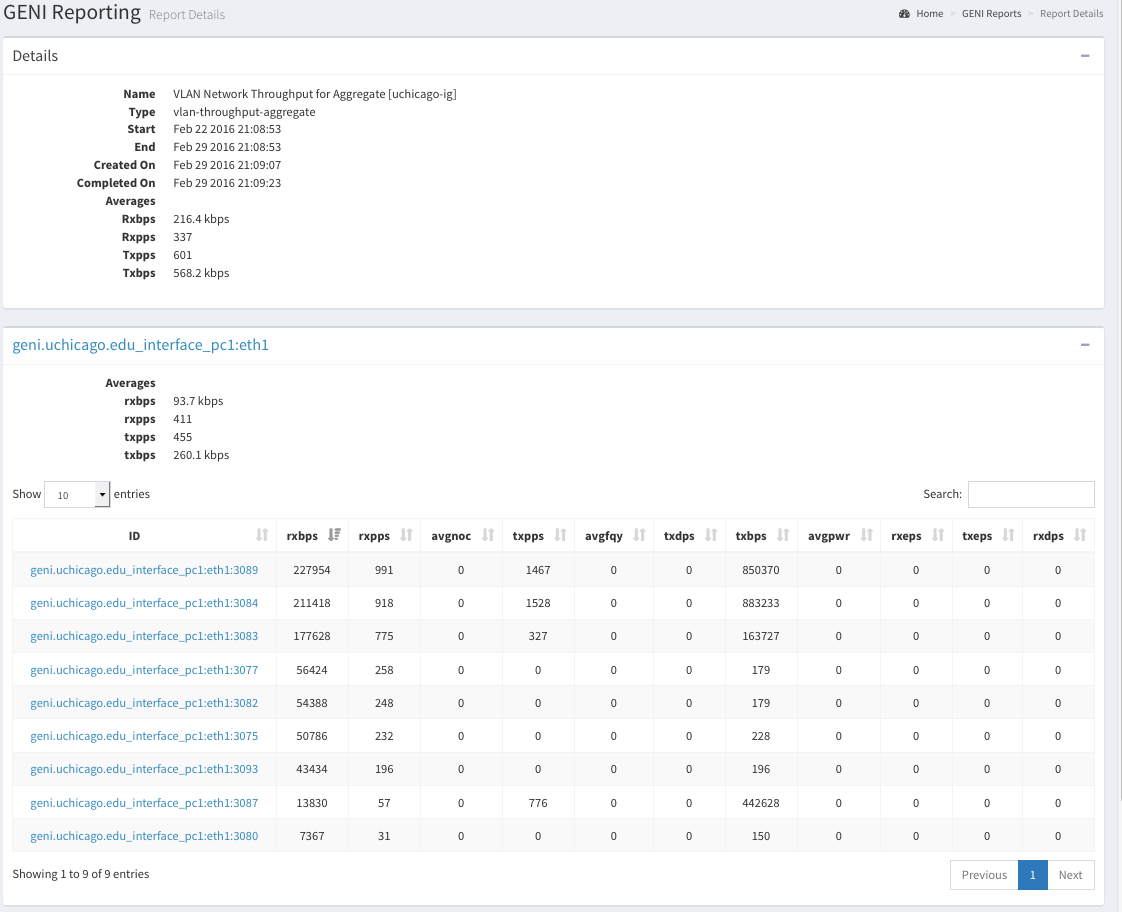
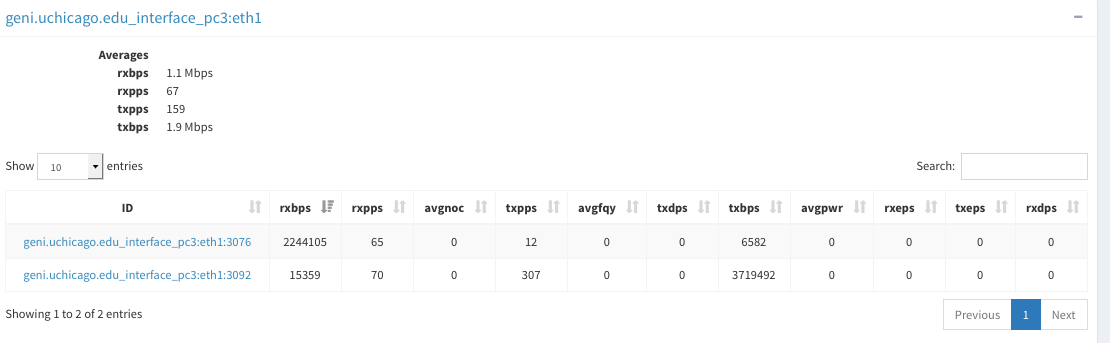
- We will use GENI reporting to find the VLAN that is the source of most traffic. Select
GENI Reporting->Reports. - On the resulting page select the "Report Type" `VLAN Network Throughput [By Aggregate] from the pull-down and in the "Report Target" type start typing "clemson", the field will automatically list all aggregate names that match, select "clemson-ig".
- In the
Reports Listresults section, choose the report named "VLAN Network Throughput for Aggregate [clemson-ig]". The report will show VLAN usage for the aggregate form highest to lowest. Pick the highest usage VLAN ID. In this procedure we will choose VLAN 1234)
- Go to
Dashboardand click on theAggregatesbutton, this shows list of all known VLANs. Narrow down the list by typing "1234" in the upper-rightSearchfield. Results will now include AL2S and Clemson monitored VLANs.
- Select "instageni.clemson.edu_interface_pc3:eth2:1234" and you will get data metrics for the VLAN 1234 at Clemson IG.
- Go back to the list of VLAN Metric available and this time choose the AL2S entry "sdn-sw.atla.net.internet2.edu:eth5/2:1234" to view statistics reported from the AL2S switch in Atlanta where Clemson is connected to AL2S Network.
Resources allocated by an Experimenter
This scenario shows how to map a GENI user ID to the resource allocation for that user's slices. In this example the user id lnevers is used.
- In
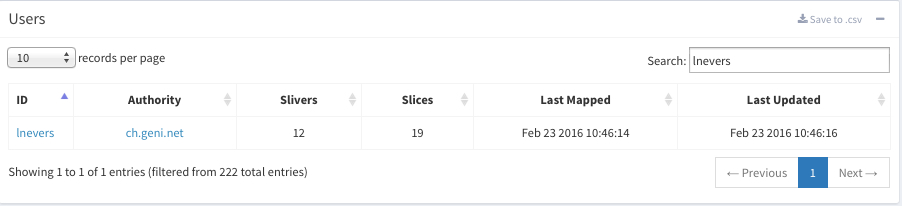
Dashboardclick on theUsersbutton, this will display all active GENI Users. Note this is not the list of all users, it is the list of users that have resources in GENI, including slices without any resources.
- Narrow down the list by typing "lnevers" in the upper-right
Searchfield, which will show the account `lnevers. From the slice results, we can see that "lnevers" has 12 Slivers and 19 Slices:

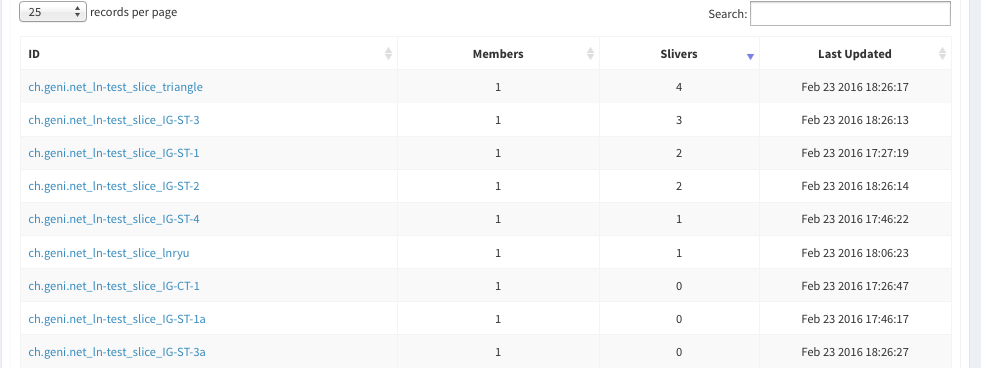
- The user "lnevers" has 12 Slivers which map to allocated resources. Note that slices are just containers and may or may not include resources. We will find resources allocated by clicking on the user ID "lnevers". The resulting page shows a Slivers tab and Slices tab for the user, select the "Slices"tab.
- In the "Slices" tab, the default list shows 10 slices, to view all 12 use the "records per page" pull-down". Once all slices are shown, sort by the "Slivers" count field to group slices that have resources. Any slice with a slivers count of zero can be ignored. In our example, there are 6 slices that have resources allocated in slivers:

Attachments (18)
- triangle-sliver-details.jpg (160.1 KB) - added by 8 years ago.
- nysernet-1714.jpg (131.8 KB) - added by 8 years ago.
- nysernet-1715.jpg (139.1 KB) - added by 8 years ago.
- nysernet-1714-usage.jpg (826.9 KB) - added by 8 years ago.
- nysernet-1715-usage.jpg (809.9 KB) - added by 8 years ago.
- clemson-aggregates.jpg (92.4 KB) - added by 8 years ago.
- lnevers-user.jpg (57.7 KB) - added by 8 years ago.
- lnevers-slice-w-resources.jpg (137.1 KB) - added by 8 years ago.
- Triangle-details.jpg (79.7 KB) - added by 8 years ago.
- network-by-slice.jpg (196.8 KB) - added by 8 years ago.
- chicago-aggregates.jpg (78.5 KB) - added by 8 years ago.
- al2s-3076.jpg (173.5 KB) - added by 8 years ago.
- chicago-aggregates.2.jpg (78.5 KB) - added by 8 years ago.
- chicago-vlan-3076.jpg (160.2 KB) - added by 8 years ago.
- chicago-vlan.jpg (296.6 KB) - added by 8 years ago.
- chicago-vlan2.jpg (96.8 KB) - added by 8 years ago.
- al2s-link.jpg (128.7 KB) - added by 8 years ago.
- al2s-sliver.jpg (129.9 KB) - added by 8 years ago.