
| Version 5 (modified by , 10 years ago) (diff) |
|---|
Part 2 Flow Statistics Experiment in LabWiki
3. Instrument your Application using LabWiki
In this part we will run the OEDL script that we wrote in the previous step. The OEDL script is called firegenipart2.oedl
3.1.1. The "Plan" Window
Now you can use the original MD script and modify it with new information on the flow statistics and the experiment that measures the flow statistics using the Trema controller API
Look here if you have to refresh your memory on how to use the prepare window.
3.1.2 The "Prepare" Window
This experiment will do the following:
3.1.2a. Start Trema controllers on the two switch nodes in the topology shown in Part1
Show in Part1
3.1.2b. Start an Iperf server on nodef
defApplication('iperfserv') do |app|
  app.description = "manually run Iperf server"
  app.binary_path = "/usr/bin/iperf -s"
end
defGroup('Receiver', property.theReceiver) do |node|
    node.addApplication("iperfserv") do |app|
    end
  end
3.1.2c. Start Iperf clients on nodea -nodee
defApplication('iperfclient') do |app|
  app.description = "manually run Iperf client"
  app.binary_path = "/usr/bin/iperf -c 192.168.1.15 -t 100 -P 2 -i 2"
end

defGroup('Sender2', property.theSender2) do |node|
    node.addApplication("iperfclient") do |app|
    end
  end
3.1.2d. Start Flow Statistics Measurement Application written in Step 1
3.1.2e. For reference, we show the Flow Statistics script here:
Note: Create a new script by clicking on the wheel and prepend your username to the name of the script. Copy and paste the contents of firegenipart2.oedl to create a copy of your own.
Please do not modify the original script.
OEDL script
defProperty('source1', "switch1-exttest7", "ID of a resource")
defProperty('theSender1', "nodeb-exttest7", "ID of a resource")
defProperty('theSender2', "nodec-exttest7", "ID of a resource")
defProperty('theSender3', "noded-exttest7", "ID of a resource")
defProperty('theSender4', "nodea-exttest7", "ID of a resource")
defProperty('theSender5', "nodee-exttest7", "ID of a resource")
defProperty('theReceiver', "nodef-exttest7", "ID of a resource")

defProperty('intervalcol',"1", "Interval to Tail")

defProperty('pathfile', "/tmp/flowstats.out", "Path to file")

defApplication('ofstats') do |app|
  app.description = 'Simple Definition for the of-collect application'
  # Define the path to the binary executable for this application
  app.binary_path = '/usr/local/bin/learn_ofcollect.rb'
  app.defProperty('target', 'Address to output file', '-f', {:type => :string})
  app.defProperty("interval","Interval",'-i', {:type => :string})
  app.defMeasurement('wrapper_ofthroughput') do |m|
    m.defMetric(':srcaddr', :string)
    m.defMetric('throughput',:int64)
  end
end

defApplication('iperfserv') do |app|
  app.description = "manually run Iperf server"
  app.binary_path = "/usr/bin/iperf -s"
end
defApplication('iperfclient') do |app|
  app.description = "manually run Iperf client"
  app.binary_path = "/usr/bin/iperf -c 192.168.1.15 -t 200 -P 5 -i 2"
end
defApplication('clean_iperf') do |app|
  app.description = 'Some commands to ensure that we start with a clean slate'
  app.binary_path = 'killall -s9 iperf'
  app.quiet = true
end
defGroup('Source3', property.source1) do |node|
  node.addApplication("ofstats") do |app|
    app.setProperty('target', property.pathfile)
    app.setProperty('interval', property.intervalcol)
    app.measure('wrapper_ofthroughput', :samples => 1)
  end
end
 defGroup('Sender1', property.theSender1) do |node|
    node.addApplication("iperfclient") do |app|
    end
  end
  defGroup('Sender2', property.theSender2) do |node|
    node.addApplication("iperfclient") do |app|
    end
  end
  defGroup('Sender3', property.theSender3) do |node|
    node.addApplication("iperfclient") do |app|
    end
  end
  defGroup('Sender4', property.theSender4) do |node|
    node.addApplication("iperfclient") do |app|
    end
  end
  defGroup('Sender5', property.theSender5) do |node|
    node.addApplication("iperfclient") do |app|
    end
  end
  defGroup('Receiver', property.theReceiver) do |node|
    node.addApplication("iperfserv") do |app|
    end
  end

onEvent(:ALL_UP_AND_INSTALLED) do |event|
  info "Starting the collect"
  info "Starting the collect"
  after 2 do
    group('Receiver').startApplications
  end
  after 10 do
    group('Sender1').startApplications
    group('Source3').startApplications
  end
  after 20 do
    group('Sender2').startApplications
  end
  after 40 do
    group('Sender3').startApplications
  end
  after 60 do
    group('Sender4').startApplications
  end
  after 80 do
    group('Sender5').startApplications
  end
  after 120 do
    info "Stopping the collect"
    allGroups.stopApplications
    Experiment.done
  end
end

defGraph 'Throughput' do |g|
  g.ms('wrapper_ofthroughput').select(:oml_ts_client, :throughput, :srcaddr)
  g.caption "Throughput of Flows"
  g.type 'line_chart3'
  g.mapping :x_axis => :oml_ts_client, :y_axis => :throughput, :group_by => :srcaddr
  g.xaxis :legend => 'oml_ts'
  g.yaxis :legend => 'Throughput', :ticks => {:format => 's'}
end
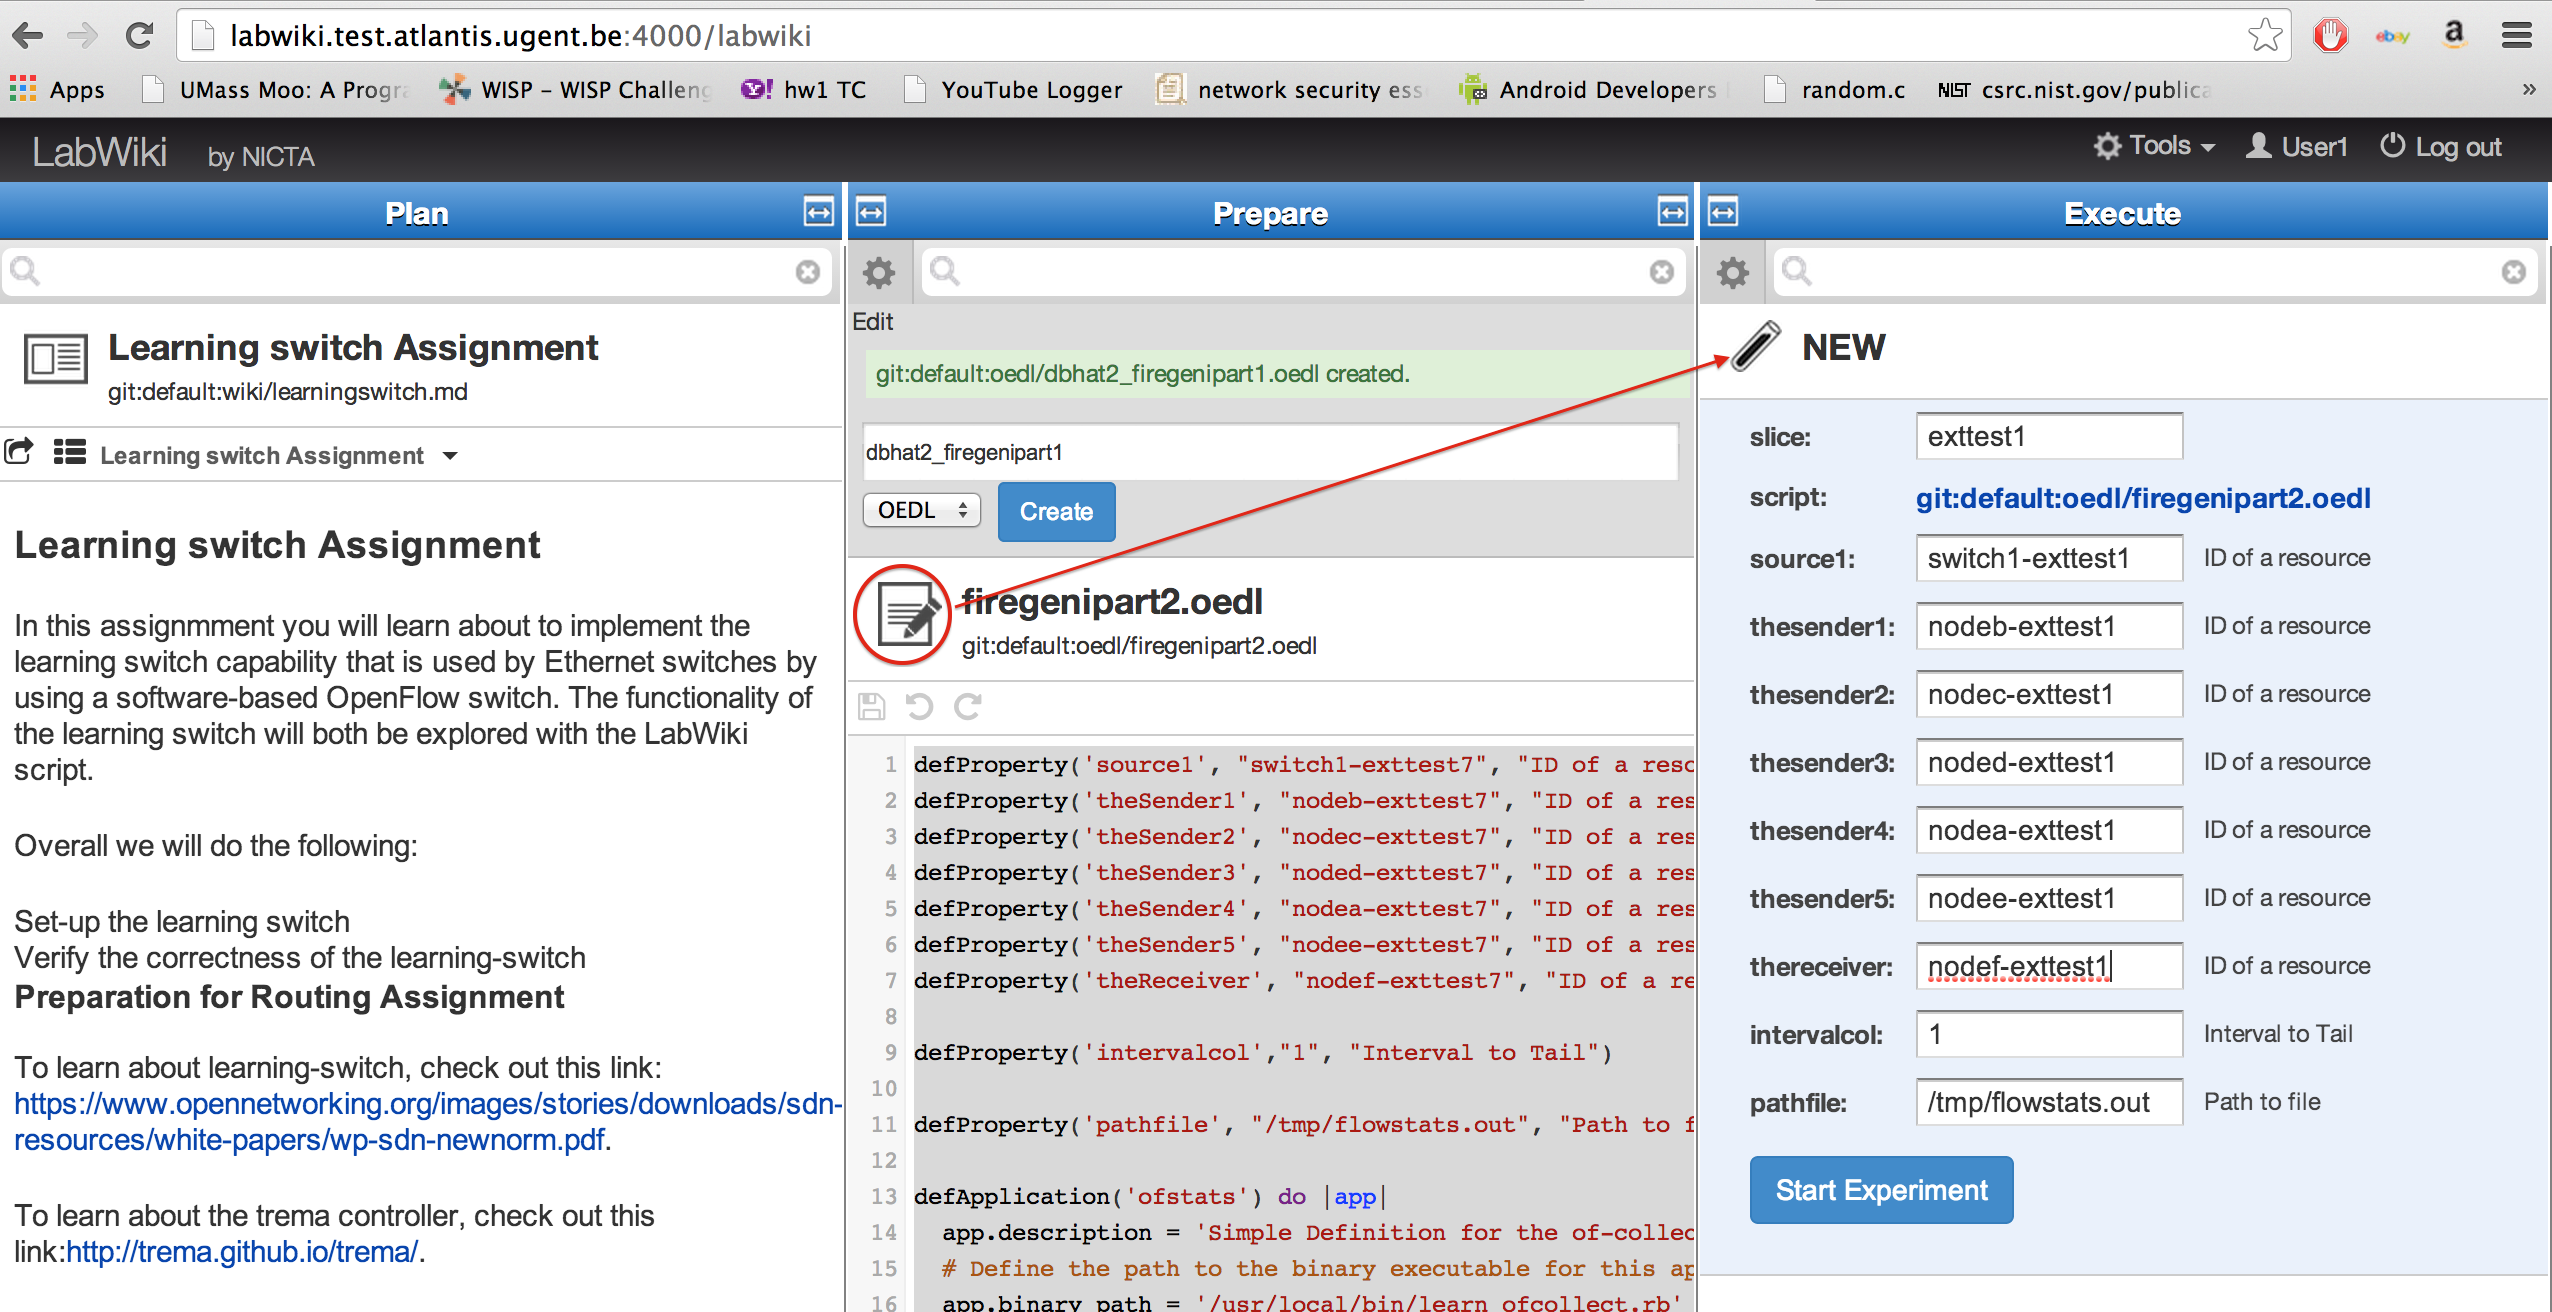
3.1.3 Start your application from LabWiki
To start your experiment, simply drag the icon that is to the left of the file name (see figure below) from the middle (Prepare) to the right (Execute) window. That will automatically fill out the experiment relevant information in this window and allow you to start the actual experiment by clicking on the "Start Experiment" button.

Explanation of the fields in the Execute window: To start your experiment, simply drag the icon that is to the left of the file name (see figure below) from the middle (Prepare) to the right (Execute) window. Explanation of the fields in the Execute window:
- name: In this field you specify the name of your experiment.
- slice: Type the name of the slice you would like to run your experiment on
*Change source1, theSender1-theSender5, theReceiver to use <hostname>-<slicename>
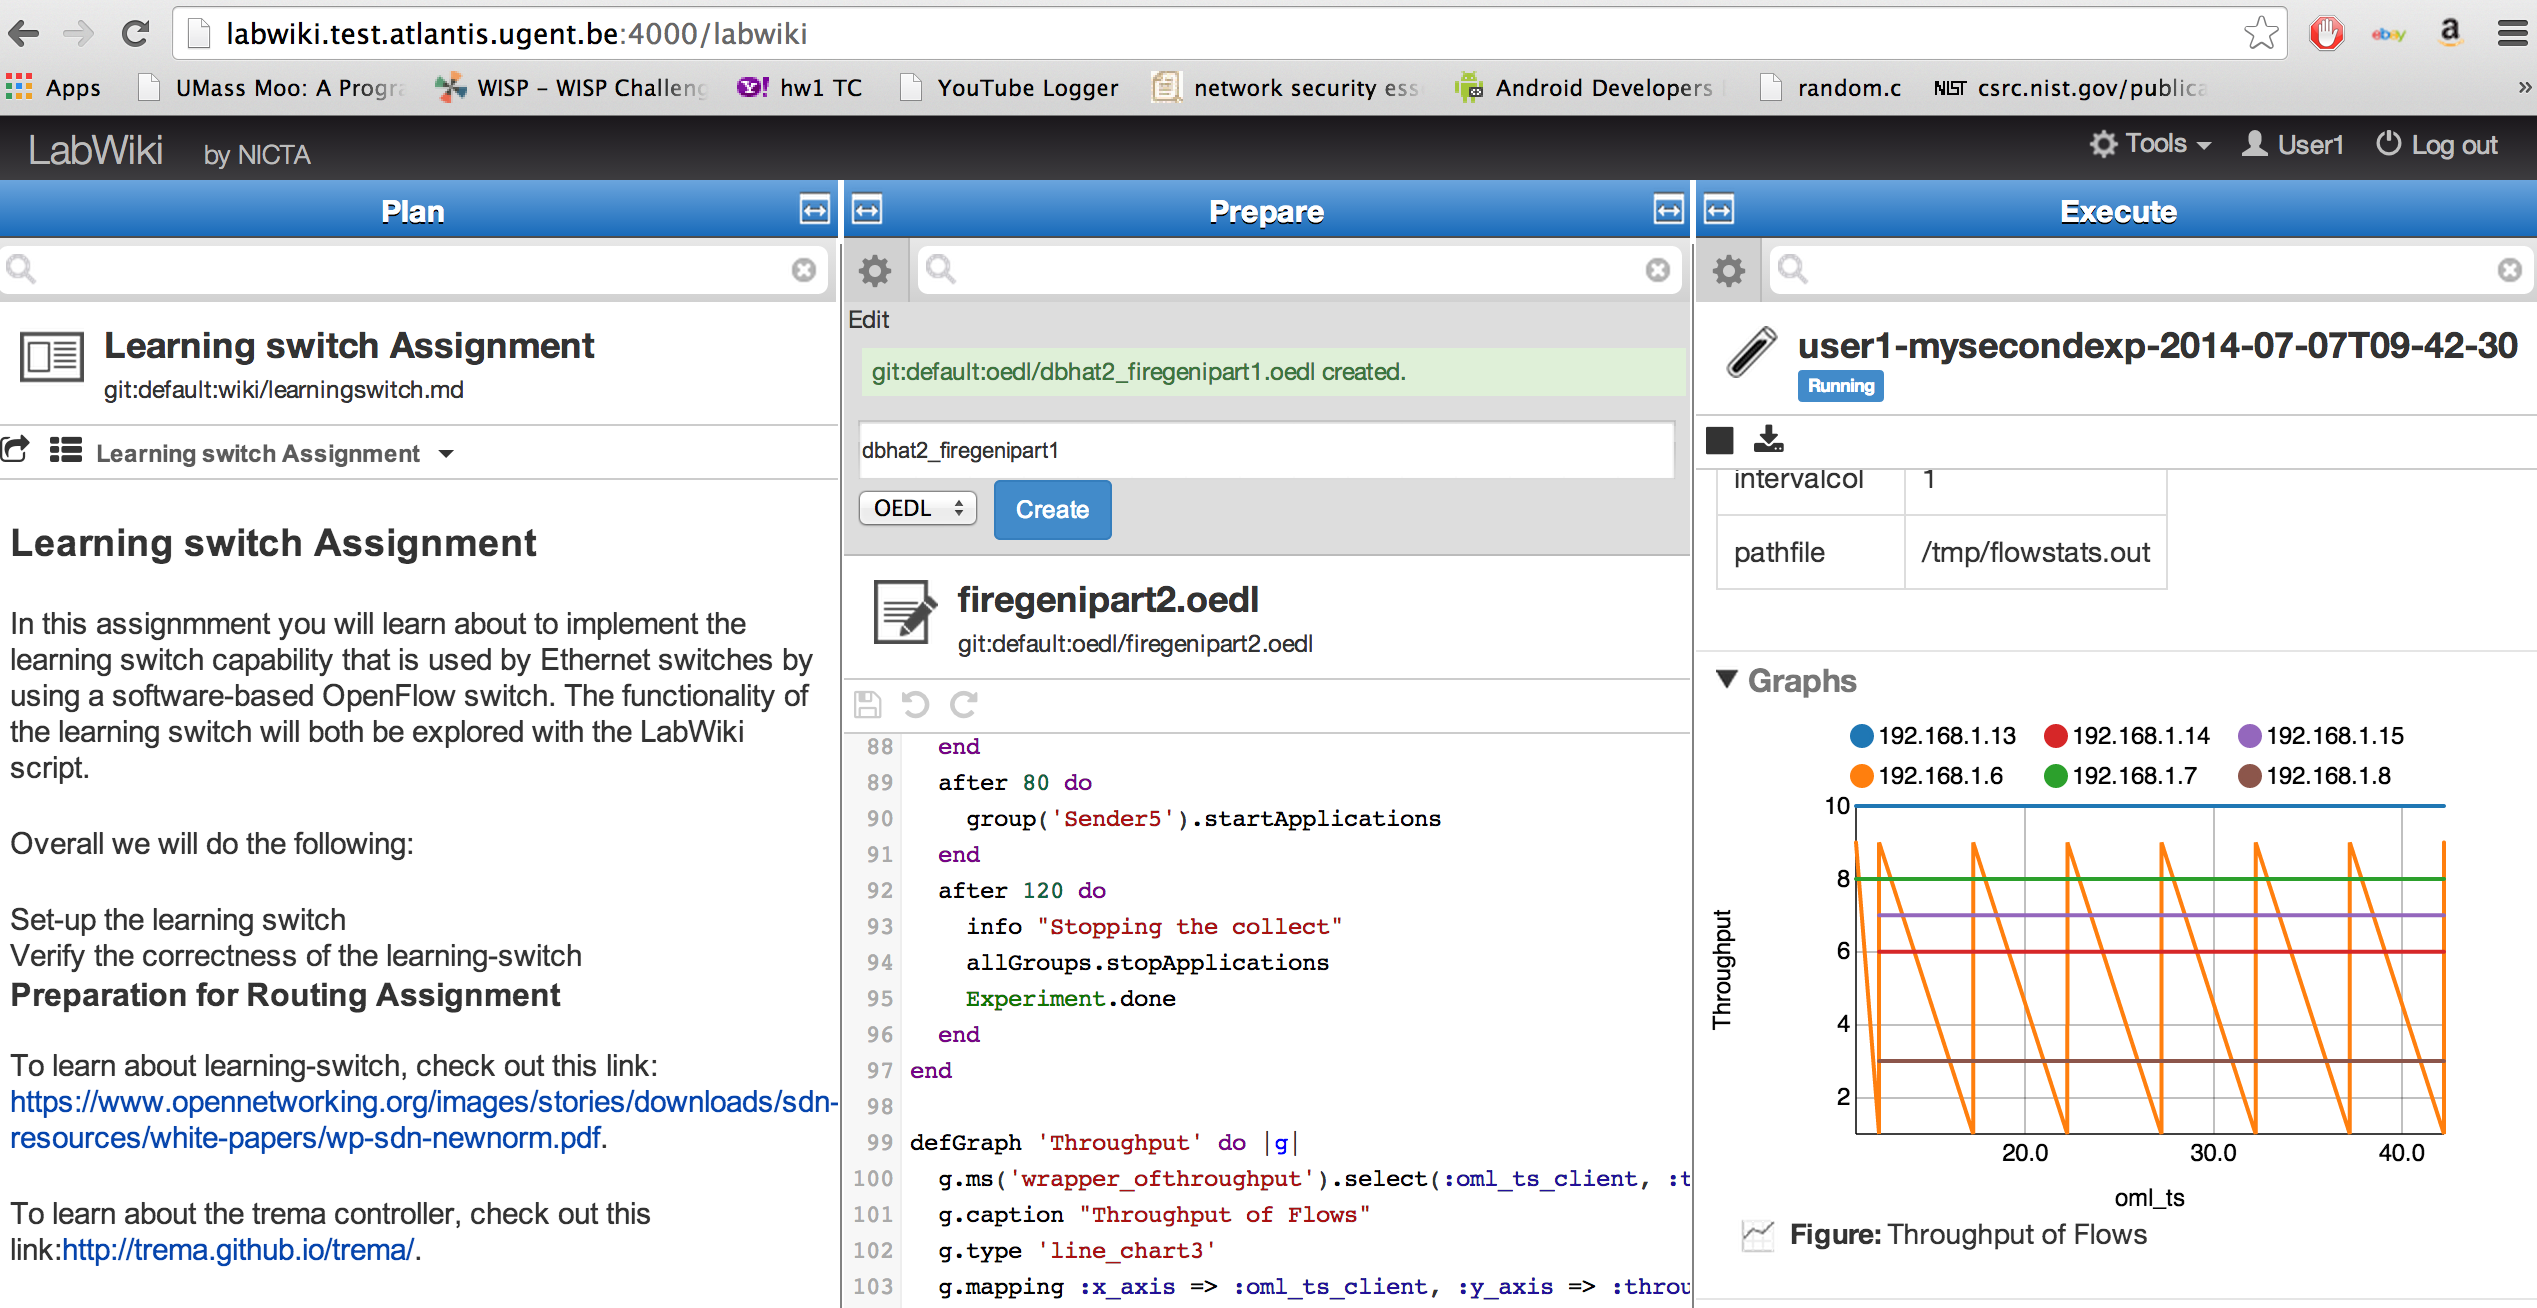
3.1.4 During experiment execution
After pressing the "Start" button, the Execute window will change and start showing status information about your experiment. The figure below gives an example for the Execute window during experiment execution.

Now the window lists experiment properties, one or several live graphs (if they have been specified in the OEDL script), and logging information. The latter would be a good starting point for trouble shooting, should your experiment not run as expected. Depending on the status of your resources and experiments, you will see one of the following statuses at the top of the Execute window:
- Pending - This is the first state of your experiment where the job scheduler adds it to the run queue. This status would remain for the first few seconds before it changes to Running or Failed
- Running - This status appears when your experiment starts running. If it fails for one or more reasons, a Failed status will appear instead
- Aborted - When you click on "Stop Experiment" at the top-left corner of the Execute window, the status changes to aborted
- Finished - When your experiment is done, you will see this status
Design
Next: Finish
Attachments (2)
- LW_wiki_flowstats2.png (564.5 KB) - added by 10 years ago.
- LW_wiki_flowstats1.png (668.3 KB) - added by 10 years ago.
Download all attachments as: .zip