
| Version 34 (modified by , 11 years ago) (diff) |
|---|
- [wiki:GENIEducation/SampleAssignments/OpenFlowLoadBalancerTutorial/Exer? …
- 1. Debugging an OpenFlow Controller
-
2. Implement a Load Balancing OpenFlow Controller
- 2.1 Experimental Setup
- 2.2 Balancing the Load
- 2.3 Use GIMI Portal to run the experiment and monitor the load balancer
- 2.4 Fetch experimental results from your iRods account
- 2.5 Change network delay and lossrate parameter of left path using tc …
- 2.6 Modify the OpenFlow Controller to maximize per-flow throughput
- 3. Hints / Explanation
- [wiki:GENIEducation/SampleAssignments/OpenFlowLoadBalancerTutorial/Exer? …
- [wiki:GENIEducation/SampleAssignments/OpenFlowLoadBalancerTutorial/Exer? …
OpenFlow Load Balancer Tutorial

1. Debugging an OpenFlow Controller
You will find it helpful to know what is going on inside your OpenFlow controller and its associated switch when implementing these exercises.
This section contains a few tips that may help you out if you are using the Open vSwitch implementation provided with this tutorial.
If you are using a hardware OpenFlow switch, your instructor can help you find equivalent commands.
The Open vSwitch installation provided by the RSpec included in this tutorial is located in /opt/openvswitch-1.6.1-F15. You will find Open vSwitch commands in /opt/openvswitch-1.6.1-F15/bin and /opt/openvswitch-1.6.1-F15/sbin. Some of these commands may be helpful to you. If you add these paths to your shell’s $PATH, you will be able to access their manual pages with man. Note that $PATH will not affect sudo, so you will still have to provide the absolute path to sudo; the absolute path is omitted from the following examples for clarity and formatting.
- ovs-vsctl
Open vSwitch switches are primarily configured using the ovs-vsctl command. For exploring, you may find the ovs-vsctl show command useful, as it dumps the status of all virtual switches on the local Open vSwitch instance. Once you have some information on the local switch configurations, ovs-vsctl provides a broad range of capabilities that you will likely find useful for expanding your network setup to more complex configurations for testing and verification. In particular, the subcommands add-br, add-port, and set-controller may be of interest. - ovs-ofctl
The switch host configured by the given rspec listens for incoming OpenFlow connections on localhost port 6634. You can use this to query the switch state using the ovs-ofctl command. In particular, you may find the dump-tables and dump-flows subcommands useful. For example, sudo ovs-ofctl dump-flows tcp:127.0.0.1:6634 will output lines that look like this:cookie=0x4, duration=6112.717s, table=0, n packets=1, n bytes=74, idle age=78,priority=5,tcp, nw src=10.10.10.0/24 actions=CONTROLLER:65535
This indicates that any TCP segment with source IP in the 10.10.10.0/24 subnet should be sent to the OpenFlow controller for processing, that it has been 78 seconds since such a segment was last seen, that one such segment has been seen so far, and the total number of bytes in packets matching this rule is 74. The other fields are perhaps interesting, but you will probably not need them for debugging. (Unless, of course, you choose to use multiple tables — an exercise in OpenFlow 1.1 functionality left to the reader.) - Unix utilities
You will want to use a variety of Unix utilities, in addition to the tools listed in ExerciseLayout, to test your controllers. The standard ping and /usr/sbin/arping tools are useful for debugging connectivity (but make sure your controller passes ICMP ECHO REQUEST and REPLY packets and ARP traffic, respectively!), and the command netstat -an will show all active network connections on a Unix host; the TCP connections of interest in this exercise will be at the top of the listing. The format of netstat output is out of the scope of this tutorial, but information is available online and in the manual pages. - Linux netem
Use the tc command to enable and configure delay and lossrate constraints on the outgoing interfaces for traffic traveling from the OpenFlow switch to the Aggregator node. To configure a path with a 20 ms delay and 10% lossrate on eth2, you would issue the command:sudo tc qdisc add dev eth2 root handle 1:0 netem delay 20ms loss 2%
Use the "tc qdisc change" command to reconfigure existing links,instead of "tc qdisc add".
2. Implement a Load Balancing OpenFlow Controller
- We will implement a Load Balancer OpenFlow Controller on node "Switch" using Trema.
- Load balancing in computer networking is the division of network traffic between two or more network devices or paths, typically for the purpose of achieving higher total throughput than either one path, ensuring a specific maximum latency or minimum bandwidth to some or all flows, or similar purposes. For this exercise, you will design a load-balancing OpenFlow controller capable of collecting flow status data from OpenFlow switches and using it to divide traffic between dissimilar network paths so as to achieve full bandwidth utilization.
- An interesting property of removing the controller from an OpenFlow device and placing it in an external system of arbitrary computing power and storage capability is that decision-making for network flows based on external state becomes reasonable. Traditional routing and switching devices make flow decisions based largely on local data (or perhaps data from adjacent network devices), but an OpenFlow controller can collect data from servers, network devices, or any other convenient source, and use this data to direct incoming flows.
- For the purpose of this tutorial, data collection will be limited to the flow statistics reported by open vswitches.
2.1 Experimental Setup
At this point, we assume that you have already created the topology, otherwise:
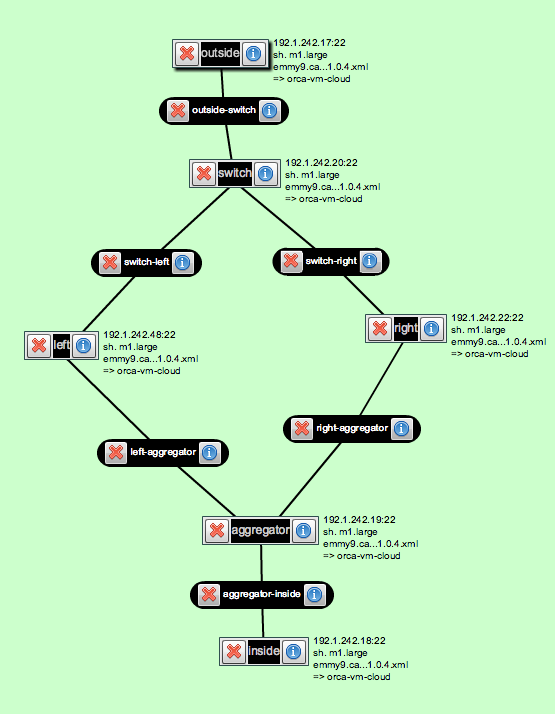
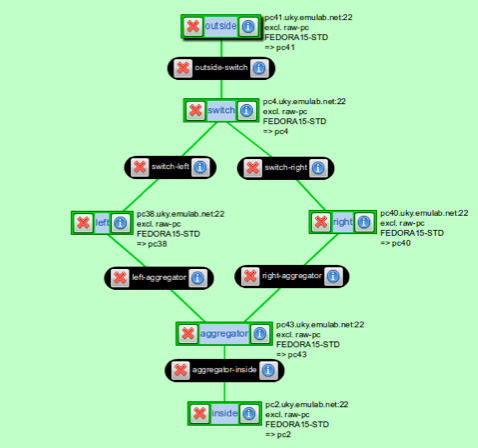
Follow instructions in the DesignSetup step to build a load balancing experiment topology. Your GENI resources will be configured in a manner similar to the above figure. The various parts of the diagram are as follows:
- Inside and Outside Nodes: These nodes can be any ExoGENI Virtual Nodes.
- Switch: This node is a Linux host running Open vSwitch. Your Load Balancing OpenFlow Controller will be running on this node as well. This is the main node that you will be working on.
- Traffic Shaping Nodes (Left and Right): These are Linux hosts with two network interfaces. You can configure netem on the two traffic shaping nodes to have differing characteristics; the specific values don’t matter, as long as they are reasonable. Use several different delay/loss combinations as you test your load balancer.
- Aggregator: This node is a Linux host running Open vSwitch with a switch controller that will cause TCP connections to “follow” the decisions made by your OpenFlow controller on the Switch node. So leave this node alone, you only need to implement the OpenFlow controller on node "Switch".
2.2 Balancing the Load
An example OpenFlow Controller that arbitrarily assigns incoming TCP connections to alternating paths is already downloaded for you. You can find it in the home directory of node "Switch".
If you did not find it, please log on to node "switch", download the load balancing controller by running:wget http://www.gpolab.bbn.com/experiment-support/OpenFlowExampleExperiment/ExoGENI/load-balancer.rb /root/
2.3 Use GIMI Portal to run the experiment and monitor the load balancer
- Log on to your LabWiki Account on http://emmy9.casa.umass.edu:3005 , on the
PrepareColumn, type "OpenFlow", it will pop up with a list of .rb choices. Choose any one, and replace the whole content with the ruby script HERE. - Log on to node "Switch" and do "ifconfig" to see the IP addresses on each interfaces.
- Note: You may not be able to see all interfaces up immediately when node "Switch" is ready; wait for some more time (about 1 min) then try "ifconfig" again.
- Identify the two interfaces that you want to monitor: the interfaces with IP address 192.168.2.1 and 192.168.3.1 respectively. On the LabWiki page, in your ruby script, find the following line:
###### Change the following to the correct interfaces ######
left = 'eth1'
right = 'eth3'
###### Change the above to the correct interfaces ######
- Change eth1 and eth3 to the corresponding two interfaces you found with IP address 192.168.2.1 (the interface that connects to the left path) and 192.168.3.1 (the interface that connects to the right path) and press the "save" icon on your LabWiki page.
- Drag the file Icon on your LabWiki page from
Preparecolumn and drop it toExecutecolumn. Fill in the name of your LabWiki experiment (this can be anything), the name of your slice (this has to be your slice name), and type "true" in the graph box to enable graph. And then press "Start Experiment" button. - Note: Do not start another experiment (i.e., drag and drop the file icon in LabWiki and press "Start Experiment") before your current experiment is finished.
2.4 Fetch experimental results from your iRods account
- Log in your iRods account on https://www.irods.org/web/index.php, use "emmy9.casa.umass.edu" as Host/IP, "1247" as Port.
- Download your experimental results from your user directory under /geniRenci/home/
2.5 Change network delay and lossrate parameter of left path using tc and repeat the experiment
- use the following command to change network condition on node "Switch": here we assume eth2 is the interface connecting node "Left". User need to use "ifconfig" to figure out the correct interface.
tc qdisc add dev eth2 root handle 1:0 netem delay 20ms loss 2%
- Did you see any difference from the graphs plotted on LabWiki, compared with the graphs plotted in the first experiment? why?
- Check out the OpenFlow Load Balancing Controller's Log on node "Switch" at "/tmp/lb.tmp" and tell how many flows are directed to the left path and how many are on the right path, why?
- To answer the above question, you need to understand the Load Balancing controller. Check out the "load-balancer.rb" file in your home directory on node "Switch". Check Section 3 for hints/explanations about this OpenFlow Controller.
2.6 Modify the OpenFlow Controller to maximize per-flow throughput
- You need to calculate the average per-flow throughput observed from both left and right path in function "stats_reply" in your load-balancer.rb
- In function "packet_in", change the path decision based on the calculated average per-flow throughput: forward the flow onto the path with more average per-flow throughput. (Why? Hint: TCP tries its best to suck up the whole bandwidth)
- If you do not know where to start, check the hints in Section 3.
- If you really do not know where to start after reading the hints, download the answer directly from Here.
- Redo the above experiment (the one with some lossrate on the left path), check the graphs plotted on LabWiki as well as the controller's log on node "Switch" at /tmp/lb.tmp and see the difference.
- If you have more time or are interested in trying out things, go ahead. The tutorial is over now and feel free to ask questions :-)
3. Hints / Explanation
3.1 About The Rspec file OpenFlowLBExo.rspec
- The Rspec file describes a topology we showed earlier--each node is assigned with certain number of interfaces with pre-defined IP addresses
- Some of the nodes are loaded with softwares and post-scripts. We will take node "Switch" as an example since it is the most complicated one.
- The following section in the Rspec file for node "Switch":
<install url="http://www.gpolab.bbn.com/experiment-support/OpenFlowExampleExperiment/software/of-switch-exo.tar.gz" install_path="/"/>
means it is going to download that tar ball from the specified URL and extract to directory "/" - The following section in the Rspec file for node "Switch":
<execute shell="bash" command="/tmp/postboot_script_exo.sh $sliceName $self.Name() ; /tmp/of-topo-setup/lb-setup"/>
names the post-boot script that ExoGENI is going to run for you after the nodes are booted.
- The following section in the Rspec file for node "Switch":
- More information about "/tmp/postboot_script_exo.sh": It is a "hook" to the LabWiki interface. Experimenter run this so that LabWiki knows the name of the slice and the hostname of the particular node that OML/OMF toolkits are running on.
- More information about "/tmp/of-topo-setup/lb-setup":
"lb-setup" is to setup the load balancing switch. The source code as well as explanation is as follows:
#!/bin/sh

/tmp/of-topo-setup/prep-trema       # install all libraries for trema
/tmp/of-topo-setup/ovs-start           # create ovs bridge

cp /usr/bin/trace-oml2 /usr/bin/trace        # a hack to the current LabWiki --> needs to be fixed
cp /usr/bin/nmetrics-oml2 /usr/bin/nmetrics       # a hack to the current LabWiki --> needs to be fixed
# download the load balancing openflow controller source code to user directory
wget http://www.gpolab.bbn.com/experiment-support/OpenFlowExampleExperiment/ExoGENI/load-balancer.rb -O /root/load-balancer.rb

INTERFACES="192.168.1.1 192.168.2.1 192.168.3.1"

# wait until all interfaces are up, then fetch the mapping from interface name to its ip/MAC address and save this info in a file /tmp/ifmap
/tmp/of-topo-setup/writeifmap3

# add port to the ovs bridge
/tmp/of-topo-setup/find-interfaces $INTERFACES | while read iface; do
    ovs-vsctl add-port br0 $iface < /dev/null
done

# create port map save it to /tmp/portmap
ovs-ofctl show tcp:127.0.0.1:6634 \
    | /tmp/of-topo-setup/ovs-id-ports 192.168.1.1=outside 192.168.2.1=left 192.168.3.1=right \
    > /tmp/portmap
3.2 About the OpenFlow controller load-balancer.rb
- Trema web site: http://trema.github.io/trema/
- Treme ruby API document: http://rubydoc.info/github/trema/trema/master/frames
- Functions used in our tutorial:
- start: is the function that will be called when the OpenFlow Controller is started. Here in our case, we read the file /tmp/portmap and figures out which OpenFlow port points to which path
- switch_ready: is the function that will be called each time a switch connects to the OpenFlow Controller. Here in our case, we allow all non-TCP flows to pass (including ARP and ICMP packets) and ask new inbound TCP flow to go to the controller.
- packet_in: is the function that will be called each time a packet arrives at the controller. Here in our case, we send out a flow_stats_request to get the current statistics about each flow. Then waits for the latest TCP flow stats. Here we create another thread to wait for the stats reply so that the controller is not blocked. Based on the latest statistics, we make our path choices.
- stats_reply: is the function that will be called when the OpenFlow Controller receives a flow_stats_reply message from the OpenFlow Switch. Here in our case, we update the flow statistics then signal the thread created in "packet_in" to continue.
- send_flow_mod_add(): is the function that you should use to add a flow entry into an OpenFlow Switch.
- The Whole Process: Upon the arrival of a new TCP flow, the OpenFlow controller sends out a "FlowStatsRequest" message to the OpenFlow switch. The OpenFlow switch will reply with statistics information about all flows in its flow table.
This flow statistics message will be fetched by the "stats_reply" function in the OpenFlow controller implemented by the user on node "Switch". Based on the statistics, experimenters can apply their own policy on which path to choose in different situations.
The FlowStatsReply message is in the following format:
FlowStatsReply.new(
  :length => 96,
  :table_id => 0,
  :match => Match.new
  :duration_sec => 10,
  :duration_nsec => 106000000,
  :priority => 0,
  :idle_timeout => 0,
  :hard_timeout => 0,
  :cookie => 0xabcd,
  :packet_count => 1,
  :byte_count => 1,
  :actions => [ ActionOutput.new ]
)
3.3 About the GIMI script you run on LabWiki
- Line 1 to Line 140: the definition of oml trace and oml nmetrics library. It basically defines the command line options for oml2-trace and oml2-nmetrics, as well as the output (the monitoring data that is going to be stored into the oml server)
- users are not supposed to modify them
- the definition here we used is not the same as what is provided by the latest OML2 2.10.0 library because there is some version mis-match between the OMF that LabWiki is using and the OML2 toolkit that we are using. It is a temporary hack for now --> to be fixed
- we added the definition of option "--oml-config" for trace app (Line 27-28) so that oml2-trace accepts configuration files:
app.defProperty('config', 'config file to follow', '--oml-config',
                :type => :string, :default => '"/tmp/monitor/conf.xml"')
- Line 140 to Line 144: user defines the monitoring interfaces here. In our case, we want to monitor the interface on node "Switch" that connects to the left path (with IP 192.168.2.2) and to the right path (with IP 192.168.3.1)
- Line 145 to Line 178: defines on which node the user wants to run which monitoring app; and the "display graph" option.
- group "Monitor" monitors the left path statistics using nmetrics and trace.
- group "Monitor1" monitors the right path statistics using nmetrics and trace.
- To monitor the throughput information, we used oml2-trace with the option of "--oml-config" which uses the configuration file we created at /tmp/monitor/conf.xml, which simply sums up the number of tcp_packet_size (in Bytes) for each second and save the info into the OML Server (in a Postgre database):
<omlc id="switch" encoding="binary"> <collect url="tcp:emmy9.casa.umass.edu:3004" name="traffic"> <stream mp="tcp" interval="1"> <filter field="tcp_packet_size" operation="sum" rename="tcp_throughput" /> </stream> </collect> </omlc> - More information about nmetrics and trace can be found here: http://oml.mytestbed.net/projects/omlapp/wiki/OML-instrumented_Applications#Packet-tracer-trace-oml2
- Line 179 to Line 246: defines the experiment:
- Line 181-182: starts the monitoring app
- Line 184-195: starts two TCP flows from outside (sender) to inside (receiver), wait for 20 seconds
- Line 196-201: starts the load balancer and connects ovs switch to the load balancer (controller)
- Line 202-236: starts 9 additional TCP flows, with 5 seconds interval between the initial of each Flow
- Line 237-245: stop the load balancer controller, disconnect the ovs switch from the controller and finish the experiment
- Line 247 to Line 264: defines the two graphs we want to plot:
- The first uses the monitoring data from oml2-nmetrics to display the cumulated number of bytes observed from each of the interfaces;
- The second graph uses the monitoring results from oml2-trace to display the throughput observed from each of the interfaces.
Introduction
Next: Teardown Experiment
Attachments (2)
- OpenFlowAssignment2.png (126.6 KB) - added by 11 years ago.
- OpenFlowLBExo.png (63.8 KB) - added by 11 years ago.
Download all attachments as: .zip