
| Version 1 (modified by , 11 years ago) (diff) |
|---|
<CCN ASSIGNMENT>

|

|

|
STEPS FOR EXECUTING EXERCISE
Objectives
The objective of this assignment is to familiarize you with named data (sometimes called content-centric) networking. You will specifically learn about:
- The Project CCNx named data networking overlay for IP networks
- Architectural features of CCNx and other content-centric networking, such as publish-subscribe content distribution, caching at intermediate nodes, and intelligent request forwarding
- Using named data networking (NDN) to fetch content from multiple sources
- The effects of cache granularity on bandwidth requirements for content distribution in a named data network
- The usage of intelligent forwarding to reduce bandwidth requirements in a collaborative environment
Tools
- ccnd
The ccnd daemon and its associated software is the reference implementation for the content-centric networking protocol proposed by Project CCNx. This assignment uses release 0.6.1 of the ccnx software package. More information on this package can be found at the Project CCNx web site, http: www.ccnx.org/. The CCN protocol embodied in CCNx is an attempt at a clean-slate architectural redesign of the Internet. - Atmos
The Atmos software package from the NetSec group at Colorado State University will provide named data for your network in the form of precipitation measurements. The Atmos tools are installed in /opt/ccnx-atmos. - NetCDF Tools
NetCDF (Network Common Data Form) is “a set of software libraries and self-describing, machine-independent data formats that support the creation, access, and sharing of array-oriented scientific data.” The NetCDF tools package provides several tools for manipulating NetCDF data, including ncks, a tool for manipulating and creating NetCDF data files; ncdump, a similar tool used for extracting data from NetCDF data files; and ncrcat, a tool for concatenating records from multiple NetCDF data files. - Flack
Flack is a graphical interface for viewing and manipulating GENI resources. It is available on the web at http://www.protogeni.net/trac/protogeni/wiki/Flack. You may use either Omni or Flack to create and manipulate your slices and slivers, but there are certain operations for which you will probably find one or the other easier to use. You will have to use the Flack client to Instrumentize your slices, as you will be directed some exercises.
Exercises
- 3.1 Routing in a Named Data Network
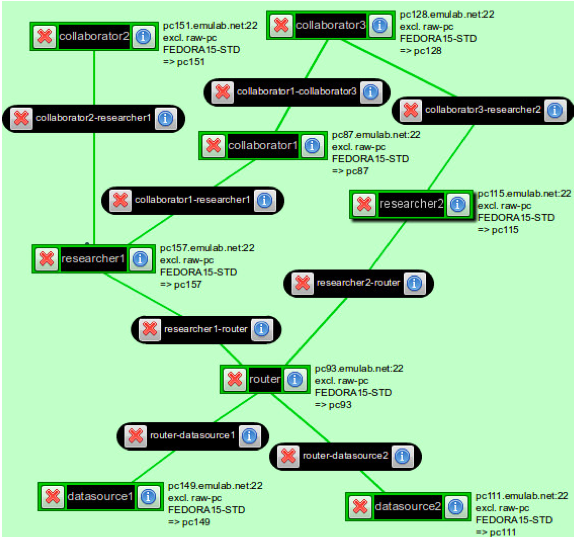
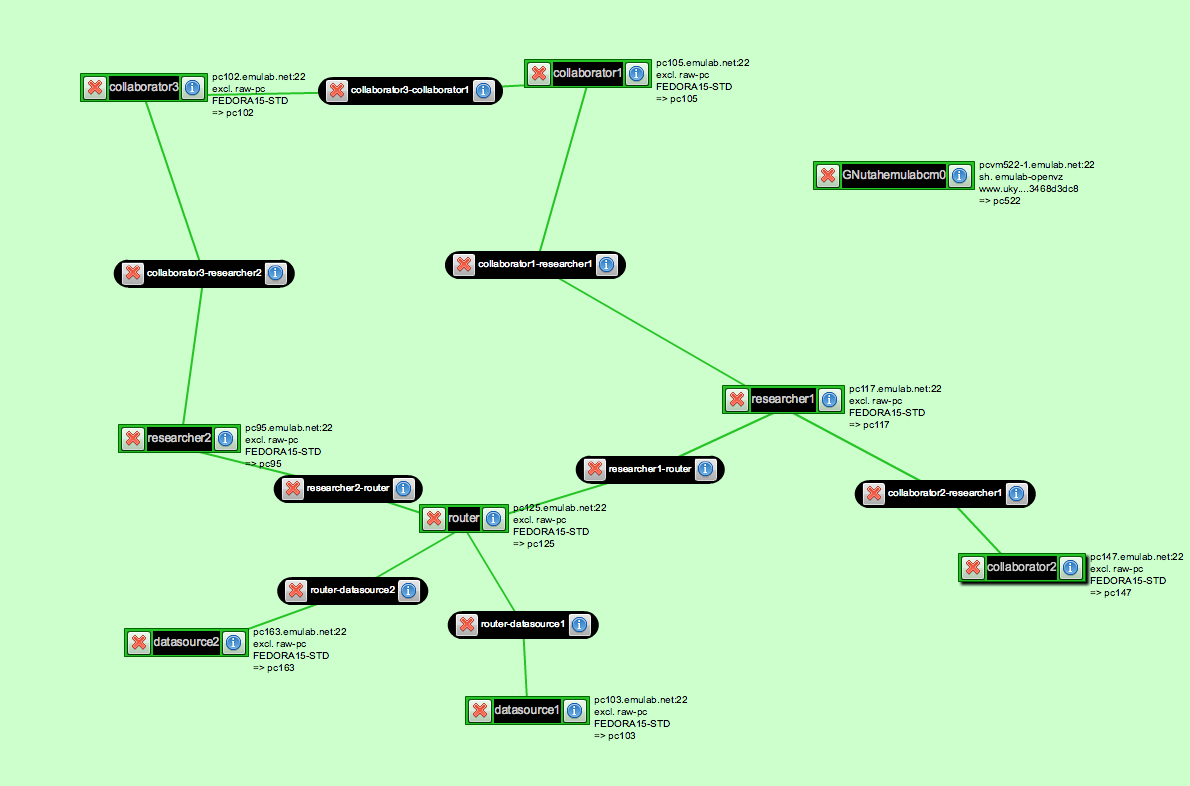
In this exercise, you will build a named data network using the Project CCNx networking daemon ccnd and transfer scientific data in the NetCDF format between data providers and data consumers using routing based on content names. For the purpose of this exercise, the network will use static routes installed at slice setup. Content will be served and consumed by the Atmos software package.
Create a GENI experiment using the precip.rspec file downloaded from here. It will allocate a network such as that depicted in the above figure, with ccnd running on every host and an Atmos server running on the hosts datastore1 and datastore2.
Routing in named data networks takes place using the namespace under which data is stored. In the case of CCNx, the data namespace is a doc/technical/URI.html URI, so it looks similar to the familiar http:// and ftp:// URLs of the World Wide Web. CCNx URIs are of the form ccnx:<path>, where <path> is a typical URI slash-delimited path. The components of the URI path are used by the network to route requests for data from consumers to the providers of that data. Routes have been installed on all of the machines in the network except researcher2, a data consumer node with two connections to the rest of the named data network.
- Task 1.1: Finalize Configuration
In this task, you will observe the effects of the missing static routes, and restore them.
Log into the host researcher1. Run the command ccninitkeystore. Issue the command ccndstatus to print the status of the ccnd daemon on the local host. Note the number of content items stored on this host (which should be zero, if you have not yet fetched any content) and the number of interests accepted (under “Interest totals”).
On researcher1, issue a request for precipitation data from 1902/01/01 through 1902/01/02. To do this, use the Atmos tools by invoking:/opt/ccnx-atmos/client.py
Answer the date questions appropriately, and observe that a .nc NetCDF file is created in the current directory containing precipitation data for the specified dates.
Run ccndstatus again, and look at the statistics on the local ccnd. You should see both that a substantial number of content items are cached on this machine (this is the meaning of the “stored” field under “Content items”) and that many more Interests have been seen.
Next, log into researcher2 and issue the same command. Observe that it takes much longer at each step, does not terminate, and no .nc file is created. This is because the ccnd on researcher1 had routes to the precipitation data requested by Atmos, but researcher2 does not. Issue the following command to install the appropriate routes:ccndc add ccnx:/ndn tcp router
Note that the ccndc command takes a content path (ccnx:/ndn) and binds it to a network path (in this case, the host router, which is a valid hostname on the experiment topology, resolving to an IP address on the router machine). It can also be used to delete routes with the del subcommand.
- Question 1.1 A:
From researcher2, fetch the same data again (from 1902/01/01 to 1902/01/02), and record the fetch times reported by client.py. It prints out the time take to pull each temporary file along with the concatenation and write time. Then fetch 1902/02/03 to 1902/02/04, and record those fetch times. Fetch 1902/02/03 to 1902/02/04 a second time, and record the new times. Which transfer was longest, and which was shortest? Knowing that each ccnd caches data for a short period of time, can you explain this behavior?
- Question 1.1 B:
Browse the content caches and interests seen on various hosts in the network by loading their ccnd status page on TCP port 9695 in your browser (see Section 5, Hints, below). Which hosts have seen interests and have content cached, and why?
Network Setup

Follow instructions in the DesignSetup step to build a firewall experiment topology. The specific host names allocated for your experiment will be different, but the topology will be isomorphic. The host labeled left in the figure is “behind” the firewall, implemented by the Open vSwitch host labeled switch. The host labeled router handles IP routing for the firewalled network, and every host on the other side of this router (the host labeled right being the only example on this topology; you may wish to add others for your testing and experimentation) are “outside” of the firewall.
The provided RSpec and the files it installs on the hosts it allocates will configure a complete, working network with an Open vSwitch running on the host labeled switch. The Open vSwitch switch is configured to connect to a controller on localhost (that is, the switch host), but no controller is started; until a controller is started on localhost, the Open vSwitch will act like a normal learning switch, forwarding all packets to the appropriate interface based on MAC address. Trema is installed in /opt/trema-trema-8e97343. Once you have implemented your switch, you can simply use this Trema install to run it and the Open vSwitch will obey its configuration.
You can test that the network configured correctly by waiting a few moments after Flack or Omni (or whatever GENI tool you are using) suggests that the sliver is ready, and running ping right from the host allocated for left or vice-versa. Since the fallback switch configuration will act like a normal learning switch, the ping packets should go through.
Firewall Configuration
The firewall configuration language is very simple. All flows not specified in the configuration are assumed to be forbidden, and the default packet processing policy on the OpenFlow device you are managing should be to drop packets. The configuration language will specify, one flow to a line, the TCP flows that should be permitted to pass the firewall. The syntax is:<ip>[/<netmask>] <port> <ip>[/<netmask>] <port>Items in angle brackets (<>) represent variable values, items in square brackets ([]) represent optional syntax, and unquoted characters (e.g., the slash characters) represent themselves. The first subnet (IP address plus mask length) and port number are the subnet and port number of the host initiating the connection (that is, sending the first bare SYN), and the second subnet and port number are those of the host accepting the connection. IP addresses are specified as dotted quads (e.g., 192.168.1.0) and netmasks as bit lengths (e.g., 24). If a netmask is missing (the IP address for a given subnet is not followed by a slash and an integer), it is equivalent to /32. Port numbers are integers. Either or both of the IP address or port numbers may be replaced by the word any, equivalent to 0.0.0.0/0 in the case of IP address, or to any port number, in the case of port numbers.
A sample configuration that implements a firewall permitting inbound connections to a web server at IP address 192.168.1.1 on port 80, and any outbound connections initiated by hosts inside the firewall (protecting 192.168.1.0/24) is as follows:any any 192.168.1.1 80 192.168.1.0/24 any any anyAll whitespace will be a single ASCII space character, all newlines will be a single ASCII newline character (0x0a) Empty lines (two newlines back-to-back) are permitted.
A connection is allowable if it matches any rule. A connection matches a rule if all four elements of the four-tuple match. Subnet matching uses standard rules, expressed in this pseudocode:boolean subnet_match(IP subnet, int bits, IP addr) { int32 bitmask = ̃((1 << 32 - bits) - 1); IP addrnet = addr & bitmask; return addrnet ˆ subnet == 0; }Note that rules are not bidirectional; the presence of the first rule in this set does not imply the second:
192.168.1.0/24 any any any
any any 192.168.1.0/24 any
This means that the first packet the controller sees that matches a flow causes the flow to be allowed. Packets that would trigger a reply that would be allowed are not necessarily allowed. The name of a firewall configuration file will be provided on the controller command line. To provide an argument to your controller application, it must be included with the controller file name. For example, to configure your firewall found in firewall.rb to load fw.conf, you would invoke:
trema run ’firewall.rb fw.conf’You will then find [’firewall.rb’, ’fw.conf’] in ARGV when your controller’s start method is invoked.
Firewall Semantics
When an OpenFlow device connects to your controller (that is, you receive a switch_ready controller event), your controller should send it instructions to:
-
- Pass all packets matching allowed connections to your controller
- Drop all other packets
Priorities are going to be critical to the correct operation of your controller, so set them carefully. Higher priority rules match before lower priority rules, and the first matching rule is followed. See Section 3.4 of the OpenFlow specification for more details on flow matching.
Upon receiving a packet from the OpenFlow device (via a OFPT_PACKET_IN message), your controller should:
-
- Ensure that the packet matches a rule in the configuration
- Insert a flow match in the OpenFlow device for the complete four-tuple matching the incoming packet
- Insert a flow match in the OpenFlow device for the complete four-tuple matching the opposite direction of the same connection
- Instruct the OpenFlow device to forward the incoming packet normally (using OFPP_NORMAL)
Packets which do not match a rule on the controller should be denied. Because your initial device configuration eliminates most of these packets outright, your controller should not see a large number of these packets.
Because this firewall implementation cannot track the actual state of the TCP connections it is managing, removing accepted connections from the forwarding tables on the OpenFlow device must be handled by timers. OpenFlow rules can be removed by an idle timer as well as expired a fixed period after insertion. For this firewall, use an idle timer of 300 seconds.
Limitations of this Approach
Note that this approach to implementing a firewall has drawbacks. Because the OpenFlow controller does not, and can not efficiently, track the precise state of the TCP flow it is forwarding, the rules are a little bit sloppy. In particular, connections “in progress” when the firewall comes online are not differentiated from new connections created after the firewall is initialized, and connection closings can not be detected by the controller. The former can be managed by inspecting the packet headers included in the OFPT_PACKET_IN message when a connection is opened, but the latter cannot easily be mitigated. This means that connections with long idle times (and 300 s is not particularly unusual, in the long tail of TCP connection statistics!) will be disconnected unnecessarily, and new connections reusing recent four-tuples may be passed through the firewall without examination by the controller.
To get you started, you can download an incomplete version of
firewall.rbfrom Here, as well as a sample fw.conf Here
Question 1. fill up the blanks in functionswitch_readyto insert rules into the openflow switch that allow ICMP and ARP packets to go through
Question 2. fill up the blanks in functionpacket_into insert a flow match in the OpenFlow device that allows the packets (as well as those in the reverse path) that match rules in the fw.conf to pass
Question 3. fill up the blanks in functionpacket_into insert rules that drops all other packets that does not match the rules specified in fw.conf
To verify your implementation, run the following on the switch:/opt/trema-trema-8e97343/trema run 'firewall.rb fw.conf'Then try to ping from left to right. Ping should go through since you allowed ICMP packets and ARP packets to pass.
If you are using the fw.conf we provided, try to run a TCP session from left to right using iperf using port 5001, 5002, 5003. Since in the fw.conf file we provided, we specifically allow TCP to go through port 5001 and 5002, but not port 5003, you should be able to see that iperf gives back throughput results for port 5001 and 5002 but not 5003.
Try play with the code as well as the fw.conf file to setup more rules, then verify your setting via iperf or telnet.
You can check the flow table on the OpenFlow Switch via:sudo /opt/openvswitch-1.6.1-F15/bin/ovs-ofctl dump-flows tcp:127.0.0.1:6634A sample output should be something like the following:
NXST_FLOW reply (xid=0x4):
 cookie=0x1, duration=165.561s, table=0, n_packets=6, n_bytes=360, idle_age=17,priority=65535,arp actions=NORMAL
 cookie=0xa, duration=43.24s, table=0, n_packets=3, n_bytes=222, idle_timeout=300,idle_age=22,priority=65535,tcp,in_port=1,vlan_tci=0x0000,dl_src=00:02:b3:65:d1:2b,dl_dst=00:03:47:94:c7:fd,nw_src=10.10.10.1,nw_dst=10.10.11.1,nw_tos=0,tp_src=46361,tp_dst=5003 actions=drop
 cookie=0x5, duration=147.156s, table=0, n_packets=18289, n_bytes=27682198, idle_timeout=300,idle_age=137,priority=65535,tcp,in_port=1,vlan_tci=0x0000,dl_src=00:02:b3:65:d1:2b,dl_dst=00:03:47:94:c7:fd,nw_src=10.10.10.1,nw_dst=10.10.11.1,nw_tos=0,tp_src=33385,tp_dst=5001 actions=NORMAL
 cookie=0x9, duration=105.294s, table=0, n_packets=4, n_bytes=296, idle_timeout=300,idle_age=60,priority=65535,tcp,in_port=1,vlan_tci=0x0000,dl_src=00:02:b3:65:d1:2b,dl_dst=00:03:47:94:c7:fd,nw_src=10.10.10.1,nw_dst=10.10.11.1,nw_tos=0,tp_src=46360,tp_dst=5003 actions=drop
 cookie=0x7, duration=124.764s, table=0, n_packets=17902, n_bytes=27095256, idle_timeout=300,idle_age=114,priority=65535,tcp,in_port=1,vlan_tci=0x0000,dl_src=00:02:b3:65:d1:2b,dl_dst=00:03:47:94:c7:fd,nw_src=10.10.10.1,nw_dst=10.10.11.1,nw_tos=0,tp_src=57908,tp_dst=5002 actions=NORMAL
 cookie=0x3, duration=165.561s, table=0, n_packets=1, n_bytes=74, idle_timeout=300,idle_age=124,priority=65535,tcp,nw_src=10.10.10.0/24,nw_dst=10.10.11.0/24,tp_dst=5002 actions=CONTROLLER:65535
 cookie=0x4, duration=165.561s, table=0, n_packets=1, n_bytes=74, idle_timeout=300,idle_age=147,priority=65535,tcp,nw_src=10.10.10.0/24,nw_dst=10.10.11.0/24,tp_dst=5001 actions=CONTROLLER:65535
 cookie=0x2, duration=165.561s, table=0, n_packets=0, n_bytes=0, idle_age=165,priority=65535,icmp actions=NORMAL
 cookie=0x6, duration=147.156s, table=0, n_packets=9387, n_bytes=624254, idle_timeout=300,idle_age=137,priority=65535,tcp,nw_src=10.10.11.1,nw_dst=10.10.10.1,tp_src=5001,tp_dst=33385 actions=NORMAL
 cookie=0x8, duration=124.764s, table=0, n_packets=9257, n_bytes=617666, idle_timeout=300,idle_age=114,priority=65535,tcp,nw_src=10.10.11.1,nw_dst=10.10.10.1,tp_src=5002,tp_dst=57908 actions=NORMAL
Hints - Want to get the complete firewall.rb? ask your instructor or visit here (you need a password to get it), or send an email (the solution code may be full of bugs, feel free to tweak it and report bugs/ask questions)
The following list of hints may help you design and debug your implementation more rapidly.
-
- Remember that OpenFlow switches are an Ethernet switch first and foremost, and that not all packets on an Ethernet are IP. In particular, your hosts will require ARP in order to pass IP traffic through the switch!
- You may pass ICMP packets without limitation, to make debugging easier.
- The Trema Match class has a compare() method that accepts a Match argument and may be useful to you — consider the ExactMatch#from() method in conjunction.
Extra Credit
For extra credit (if permitted by your instructor), generate TCP reset segment at the firewall to reset rejected connections.
- 3.2 Extending the Firewall
OpenFlow controllers can also make complex flow decisions based on arbitrary state. This is one benefit to removing the controller from the network device — the controller is free to perform any computation required over whatever data is available when making decisions, rather than being constrained to the limited computing power and storage of the network device. For this exercise, you will extend the firewall described in Section 3.1 to include rudimentary denial of service prevention using this capability.
Extended Firewall Configuration
You will extend the firewall configuration language to accept an additional final parameter, an integer representing the number of allowable connections matching a given rule at any point in time. As before, the keyword any will be used to indicate that no limiting is to be performed on the rule. The new firewall configuration syntax is:<ip>/<netmask> <port> <ip>/<netmask> <port> <limit>
Connection Limiting Semantics
The extended firewall will perform flow matching as before, with one added check: if the number of existing flows allowed by a given rule exceeds the limit specified in the configuration, a new flow matching that rule will be denied. The number of existing flows matching a given rule is computed as the number of currently active flow matches in the OpenFlow device for that rule. You may wish to look into the OFPT_FLOW_REMOVED message for help in implementing this. If a connection rule specifies any as the flow limit, no limiting will be performed by the controller.
Note that the timeout-based nature of flow removal dictates that small connection limits will be quite limiting. Keep this in mind when testing your firewall!
Question: extend the firewall.rb to take the new firewall configuration file and accept the additional parameter Hints: Want to get the complete firewall.rb? ask your instructor or visit here (you need a password to get it), or send an email (the solution code may be full of bugs, feel free to tweak it and report bugs/ask questions)
You probably want to change therulestructure defined in functionadd_ruleto add two members:limitandcountto store the maximum number of active flows allowed and the current number of active flows.
You should also over-ride the functionflow_removedto subtractcountwhen-ever a flow rule expired.
You might also set the idle_timeout to a smaller number (e.g., 30) so that you do not need to wait for too long before they get removed :-)
To verify your implementation, use-Poption in iperf to add TCP flows.
- 3.3 Load Balancing -- Files to download: lb.rspec, load-balancer.rb, netinfo.py
Load balancing in computer networking is the division of network traffic between two or more network devices or paths, typically for the purpose of achieving higher total throughput than either one path, ensuring a specific maximum latency or minimum bandwidth to some or all flows, or similar purposes. For this exercise, you will design a load-balancing OpenFlow controller capable of collecting external data and using it to divide traffic between dissimilar network paths so as to achieve full bandwidth utilization with minimal queuing delays.
An interesting property of removing the controller from an OpenFlow device and placing it in an external system of arbitrary computing power and storage capability is that decision-making for network flows based on external state becomes reasonable. Traditional routing and switching devices make flow decisions based largely on local data (or perhaps data from adjacent network devices), but an OpenFlow controller can collect data from servers, network devices, or any other convenient source, and use this data to direct incoming flows.
For the purpose of this exercise, data collection will be limited to the bandwidth and queue occupancy of two emulated network links.
Experimental Setup
Follow instructions in the DesignSetup step to build a load balancing experiment topology. Your GENI resources will be configured in a manner similar to the above figure. The various parts of the diagram are as follows:
-
- Inside and Outside Nodes: These nodes can be any exclusive ProtoGENI PCs.
- Switch: The role of the Open vSwitch node may be played either by a software Open vSwitch installation on a ProtoGENI node, or by the OpenFlow switches available in GENI — consult your instructor.
- Traffic Shaping Nodes (Left and Right): These are Linux hosts with two network interfaces. You can configure netem on the two traffic shaping nodes to have differing characteristics; the specific values don’t matter, as long as they are reasonable. (No slower than a few hundred kbps, no faster than a few tens of Mbps with 0-100 ms of delay would be a good guideline.) Use several different bandwidth combinations as you test your load balancer.
- Aggregator: This node is a Linux host running Open vSwitch with a switch controller that will cause TCP connections to “follow” the decisions made by your OpenFlow controller on the Switch node.
Linux netem
Use the tc command to enable and configure delay and bandwidth constraints on the outgoing interfaces for traffic traveling from the OpenFlow switch to the Aggregator node. To configure a path with 20 Mbps bandwidth and a 20 ms delay on eth2, you would issue the command:sudo tc qdisc add dev eth2 root handle 1:0 netem delay 20ms sudo tc qdisc add dev eth2 parent 1:0 tbf rate 20mbit buffer 20000 limit 16000See the tc and tc-tbf manual pages for more information on configuring tc token bucket filters as in the second command line. Use the tc qdisc change command to reconfigure existing links,instead of tc qdisc add.
The outgoing links in the provided lb.rspec are numbered 192.168.4.1 and 192.168.5.1 for left and right, respectively.
Balancing the Load
An example openflow controller that arbitrarily assigns incoming TCP connections to alternating paths can be found at load-balancer.rb (If you have already downloaded it, ignore this).
The goal of your OpenFlow controller will be to achieve full bandwidth utilization with minimal queuing delays of the two links between the OpenFlow switch and the Aggregator host. In order to accomplish this, your OpenFlow switch will intelligently divide TCP flows between the two paths. The intelligence for this decision will come from bandwidth and queuing status reports from the two traffic shaping nodes representing the alternate paths.
When the network is lightly loaded, flows may be directed toward either path, as neither path exhibits queuing delays and both paths are largely unloaded. As network load increases, however, your controller should direct flows toward the least loaded fork in the path, as defined by occupied bandwidth for links that are not yet near capacity and queue depth for links that are near capacity.
Because TCP traffic is bursty and unpredictable, your controller will not be able to perfectly balance the flows between these links. However, as more TCP flows are combined on the links, their combined congestion control behaviors will allow you to utilize the links to near capacity, with queuing delays that are roughly balanced. Your controller need not re-balance flows that have previously been assigned, but you may do so if you like.
The binding of OpenFlow port numbers to logical topology links can be found in the file /tmp/portmap on the switch node when the provided RSpec boots. It consists of three lines, each containing one logical link name (left, right, and outside) and an integer indicating the port on which the corresponding link is connected. You may use this information in your controller configuration if it is helpful.
You will find an example OpenFlow controller that arbitrarily assigns incoming TCP connections to alternating paths in the file load-balancer.rb. This simple controller can be used as a starting point for your controller if you desire. Examining its behavior may also prove instructive; you should see that its effectiveness at achieving the assignment goals falls off as the imbalance between balanced link capacities or delays grows.
Gathering Information
The information you will use to inform your OpenFlow controller about the state of the two load-balanced paths will be gathered from the traffic shaping hosts. This information can be parsed out of the file /proc/net/dev, which contains a line for each interface on the machine, as well as the tc -p qdisc show command, which displays the number of packets in the token bucket queue. As TCP connections take some time to converge on a stable bandwidth utilization, you may want to collect these statistics once every few seconds, and smooth the values you receive over the intervening time periods.
You may find the file /tmp/ifmap on the traffic shaping nodes useful. It is created at system startup, and identifies the inside- and outside-facing interfaces with lines such as:inside eth2 outside eth1The first word on the line is the “direction” of the interface — toward the inside or outside of the network diagram. The second is the interface name as found in /proc/net/dev.
You are free to communicate these network statistics from the traffic shaping nodes to your OpenFlow controller in any fashion you like. You may want to use a web service, or transfer the data via an external daemon and query a statistics file from the controller. Keep in mind that flow creation decisions need to be made rather quickly, to prevent retransmissions on the connecting host.
Questions
To help user to fetch the information about the amount of traffic as well as the queue depth (measured in number of packets) on both left and right node, we provide a script that the user can download and run on both left and right node
You can download the script from netinfo.py (If you have already downloaded it, ignore this). Then do the following to start monitoring network usage:
-
- 1. install Twisted Web package for Python on both left and right node:
sudo yum install python-twisted-web
- 2. upload netinfo.py onto left and right node, then change the listening IP address in netinfo.py to the public IP address of left and right node respectively. i.e., replacing the following 0.0.0.0 in your netinfo.py file to the public IP address of the left/right node.
reactor.listenTCP(8000, factory, interface = '0.0.0.0')
- 3. apply qdisc on interface eth1 of both left and right node by executing (you may further change the parameters by using tc qdisc change):
sudo /sbin/tc qdisc add dev eth1 root handle 1:0 netem delay 20ms
sudo /sbin/tc qdisc add dev eth1 parent 1:0 tbf rate 20mbit buffer 20000 limit 16000
- 4. run the script by:
python netinfo.py
- 5. verify it is working by opening a web browser and typing the following URL (replacing 155.98.36.69 with your left or right node's public IP address):
http://155.98.36.69:8000/qinfo/0
For more information about netinfo.py, please look at the comments in the file.
- 1. install Twisted Web package for Python on both left and right node:
To help you get started, the following is the ruby class that helps collecting the monitoring results:
class DataCollector
    @@Weight = 0.2

    attr_reader :port

    def initialize(host, port)
        @host = host
        @uri = 'http://' + host + ':8000/qinfo/'
        @last = 0
        @ewmabytes = 0
        @ewmapkts = 0
        @lock = Mutex.new
        @port = port
    end

    def run
        starttime = Time.now.to_f
        while true
            data = Net::HTTP.get(URI(@uri + @last.to_s))
            data.each do |line|
                ts, bytes, qlen = line.chomp.split(' ').map { |x| x.to_i }
                @lock.synchronize do
                    if ts <= @last
                        next
                    elsif @last == 0
                        @ewmabytes = bytes
                        @ewmapkts = qlen
                    else
                        # Just assume we haven't missed too many entries
                        @ewmabytes = bytes * @@Weight + @ewmabytes * (1 - @@Weight)
                        @ewmapkts = qlen * @@Weight + @ewmapkts * (1 - @@Weight)
                    end
                    @last = ts
                end
            end
            sleep 5
        end
    end

    def averages
        a = nil
        @lock.synchronize do
            a = [@ewmabytes, @ewmapkts]
        end
        return a
    end
end
In the above code, function averages will return the weighted average number of bytes seen in the corresponding node, as well as the weighted average queue depth in terms of number of packets seen in the corresponding node.
Here is some example code that makes use of this class:@collectors = [DataCollector.new($leftip, @leftport), DataCollector.new($rightip, @rightport)] @collectors.each do |collector| Thread.new(collector) do |c| c.run end end left_monitor_value = @collectors[0].averages right_monitor_value = @collectors[1].averages #left_monitor_value[0] shows the average number of bytes seen on the left node #left_monitor_value[1] shows the average number of queued packets on the left node
Question: Implement your load-balancer.rb, run it on switch, and display the number of bytes and queue length on both left and right node when a new TCP flow comes and path decision is made
A sample output should be as follows:
left:  5302.5338056252 bytes, Q Depth: 20.5240502532964 packets
right: 14193.5212452065 bytes, Q Depth: 27.3912943665466 packets
so this new flow goes left. Total number of flows on left: 1
You can use iperf to generate TCP flows from outside node to inside node:
-
- On inside, run:
/usr/local/etc/emulab/emulab-iperf -s
- On outside run the following multiple times, with about 6 seconds interval between each run:
/usr/local/etc/emulab/emulab-iperf -c 10.10.10.2 -t 100 &
This will give the netinfo.py enough time to collect network usage statistics from both left and right node so that the load-balancer can make the right decision.
- On inside, run:
If you really do not know where to start, you can find a semi-complete load-balancer.rb HERE, you only need to complete the next_path function that prints out the statistics of each path and returns the path choice
Hints: Want to get the complete load-balancer.rb? ask your instructor or visit here (you need a password to get it), or send an email (the solution code may be full of bugs, feel free to tweak it and report bugs/ask questions)
-
- Remember that the TCP control loop is rathers low — on the order of several round trip times for the TCP connection. This means your load balancing control loop should be slow.
- You may wish to review control theory, as well as TCP congestion control and avoidance principles.
- Without rebalancing, “correcting” a severe imbalance may be difficult or impossible. For testing purposes, add flows to the path slowly and wait for things to stabilize.
- Some thoughts on reducing the flow count when load balancing via Open- Flow can be found in Wang et al. You are not required to implement these techniques, but may find them helpful.
- Remember that the default OpenFlow policy for your switch or Open vSwitch instance will likely be to send any packets that do not match a flow spec to the controller, so you will have to handle or discard these packets.
- You will want your load balancer to communicate with the traffic shaping nodes via their administrative IP address, available in the slice manifest.
- If packet processing on the OpenFlow controller blocks for communication with the traffic shaping nodes, TCP performance may suffer. Use require ’threads’, Thread, and Mutex to fetch load information in a separate thread.
- The OpenFlow debugging hints from Section 3.1 remain relevant for this exercise.
Next: Teardown Experiment
Attachments (2)
- CCNAssignment.png (253.3 KB) - added by 11 years ago.
- topology1.png (115.9 KB) - added by 11 years ago.
Download all attachments as: .zip