| Version 29 (modified by , 12 years ago) (diff) |
|---|
-
Basic Experiment with GEMINI v1.1 I&M Tools: Instructions
- Preparation
-
Steps
- 0) Overview of experiment
- 1) Establish experiment environment
- 2) Obtain slice of GENI resources, install I&M tools and experiment …
- 3) Configure I&M tools and experiment services
- 4) Run and orchestrate I&M services and experiment services to …
- 5) Analyze and visualize measurement results after completing run of …
- 6) Move selected collected measurements and other artifacts from …
- 7) Release experiment resources
Basic Experiment with GEMINI v1.1 I&M Tools: Instructions
Preparation
This tutorial assumes that attendees have a basic knowledge of ProtoGENI/InstaGENI, and we recommend that interested participants also consider attending the InstaGENI tutorial offered at GEC 15.
Active participants will need a laptop equipped with a recent version of Virtual Box. If you are unable to bring one, you may partner with someone else.
Steps
0) Overview of experiment
The instructions on this page are designed for the GEMINI Tutorial at GEC 15. This tutorial covers how to instrumentize a GENI slice using the GEMINI I&M system.
The GEMINI I&M system provides an easy way to instrumentize a GENI slice with passive and active measurements. The current version of GEMINI provides host monitoring metrics (cpu, memory, network) and tools to perform on-demand and regular active measurements for throughput, one-way latency and round-trip latency (both with jitter and loss).
Users can specify through their request RSpec which nodes should have passive instrumentation (e.g. host monitoring) and which nodes should active measurement services installed. While most passive instrumentation is always on, active measurements must be configured by the user. This is done through a web interface available on a instrumentized slice. A key service for this to work in GEMINI is UNIS: Unified Network Information Service.
UNIS and Topology-based Configuration: The Unified Network Information Service (UNIS) is the most important
component of the GEMINI architecture. For those familiar with perfSONAR, this service is the combination of
the Lookup Service and the Topology Service of the perfSONAR framework. UNIS stores the topology data of GENI
slices, and services register themselves so that they can be found dynamically. The configuration of the
active measurement services is done through annotations on the topology data. A web interface is provided to
configure the active measurements and push the configuration to UNIS.
0.1) Goals
In this tutorial you will learn all the steps necessary to fully utilize the GEMINI I&M system, from instrumentizing and bootstrapping your slice to configuring measurements to visualizing and archiving the data.
0.2) Configuration
For the tutorial given at GEC15, the slices will be pre-made and instrumentized. The information for the slice will be given to you on an info sheet and you can also find your information here. Make sure you are accessing your slice!
0.3 Process (flow chart)
TODO
1) Establish experiment environment
In order to make using GEMINI easier we provide a User Workspace Virtual Machine. The User Workspace is an environment that contains all of the tools and configuration necessary to set up your slice and install and configure the GEMINI instrumentation and measurement tools. These tools include:
- GEMINI
- /home/geniuser/Tutorials/GEMINI/common
- The GEMINI tools and the rspec used in the tutorial (gec15.xml)
- /home/geniuser/Tutorials/GEMINI/common
- OMNI
- Version 2.1 installed in /usr/local/bin/gcf
More information about the User Workspace can be found at http://groups.geni.net/geni/wiki/GENIUserWorkspace.
Before configuring your slice, you will need to configure a few things for your user by following these instructions.
After GEC15, you can configure your own GENI credentials according to the Configuring Credentials instructions.
1.1) Preparing the User workspace Virtual Machine
- Install VirtualBox
Download the VirtualBox software from http://www.virtualbox.org.
If you already have VirtualBox installed on your machine, make sure it is version 4.1 or above.
- Download VirtualBox VM image for tutorials
Download the VirtualBox VM image (GEC15_Tutorials_Final.ova) from the website https://www.planet-lab.org/GEC15/
- Install the GEC15_Tutorials_Final.ova virtual machine image
Start up VirtualBox, select File->Import Appliance..., and follow the instructions. Accept the default VM settings during the import.
To run the virtual machine, go to the Oracle VM VirtualBox Manager window, select the VM and click the green arrow labeled Start at the top of this window.
If the install was successful, you should see the logon screen for the Ubuntu OS.
1.2) Gather necessary keys, certificates and credentials
For the purpose of this tutorial we created temporal credentials. Follow these instructions.
2) Obtain slice of GENI resources, install I&M tools and experiment services
In order to save time, The steps in this section is already precooked for the purpose of this tutorial.
2.1) Formulate slice topology for experiment, and build request rspec
In order to use the GEMINI I&M system to instrument your slice, you have to add GEMINI specific rspec extensions to your slice. This can be done at the time you create your rspec. The GEMINI I&M system requires that you add an extra node with public IP address into your slice that we call as the GLOBAL Node (GN). This node does not need to have any links to any other nodes in your slice.
To designate a node as a GLOBAL Node add the following section in the node section of the rspec as shown below
<gemini:node type="global_node">
  <gemini:monitor_urn name="urn:publicid:IDN+uky.emulab.net+authority+cm">
 </gemini:monitor_urn>
</gemini:node>

<!-- To make this node with public IP address -->
<emulab:routable_control_ip xmlns="http://www.protogeni.net/resources/rspec/ext/emulab/1"/>
The monitor-urn tag defines which Aggregate's Node this Global Node is supposed to monitor. In our example above, this node is supposed to monitor the nodes at the Kentucky Aggregate.
All other nodes (raw-pc or virtual nodes) to be monitored using GEMINI should be designated with a GEMINI rspec extension that defines them as a MP Node (measurement point node) as shown below
<gemini:node type="mp_node">
  <gemini:services>
    <gemini:active install="yes" enable="yes"/>
    <gemini:passive install="yes" enable="yes"/>
  </gemini:services>
</gemini:node>
For each MP node you also have to define if you would like to have active or passive monitoring installed and/or enabled . The above snippet requests that both active and passive monitoring be installed and enabled on the node.
Using the above mentioned GEMINI rspec extensions along with its xmlns schema definition in the rspec (xmlns:gemini="http://geni.net/resources/rspec/ext/gemini/1"), you can create a Slice which can later be instrumentized using GEMINI. For example, our Tutorial topology rspec would look like
<rspec type="request" generated_by="Flack" generated="2012-10-10T16:34:53Z" xsi:schemaLocation="http://www.geni.net/resources/rspec/3 http://www.geni.net/resources/rspec/3/request.xsd " xmlns:flack="http://www.protogeni.net/resources/rspec/ext/flack/1" xmlns:client="http://www.protogeni.net/resources/rspec/ext/client/1" xmlns:xsi="http://www.w3.org/2001/XMLSchema-instance" xmlns:gemini="http://geni.net/resources/rspec/ext/gemini/1" xmlns="http://www.geni.net/resources/rspec/3">
  <node client_id="VM-1" exclusive="false" xmlns:rs="http://www.protogeni.net/resources/rspec/ext/emulab/1">
    <rs:vnode name="pcvm62-6"/>
    <sliver_type name="emulab-openvz"/>
    <interface client_id="VM-1:if0">
      <ip address="10.128.2.2" netmask="" type="ipv4"/>
      <flack:interface_info addressUnset="false"/>
    </interface>
    <interface client_id="VM-1:if1">
      <ip address="10.128.3.2" netmask="" type="ipv4"/>
      <flack:interface_info addressUnset="false"/>
    </interface>
    <interface client_id="VM-1:if2">
      <ip address="10.128.4.1" netmask="" type="ipv4"/>
      <flack:interface_info addressUnset="false"/>
    </interface>
    <gemini:node type="mp_node">
      <gemini:services>
        <gemini:active install="yes" enable="yes"/>
        <gemini:passive install="yes" enable="yes"/>
      </gemini:services>
    </gemini:node>
    <services>
      <execute command="sudo /tmp/installer/installer.sh" shell="sh"/>
      <install install_path="/tmp" url="http://www.uky.emulab.net/INSTOOLS/3.5/tarballs/installer.tgz"/>
      <install install_path="/" url="http://www.uky.emulab.net/INSTOOLS/3.5/tarballs/sudoers.tgz"/>
    </services>
    <flack:node_info x="91" y="183" unbound="true"/>
  </node>
  <node client_id="VM-2" exclusive="false" xmlns:rs="http://www.protogeni.net/resources/rspec/ext/emulab/1">
    <rs:vnode name="pcvm62-7"/>
    <sliver_type name="emulab-openvz"/>
    <interface client_id="VM-2:if0">
      <ip address="10.128.1.1" netmask="" type="ipv4"/>
      <flack:interface_info addressUnset="false"/>
    </interface>
    <interface client_id="VM-2:if1">
      <ip address="10.128.4.2" netmask="" type="ipv4"/>
      <flack:interface_info addressUnset="false"/>
    </interface>
    <interface client_id="VM-2:if2">
      <ip address="10.128.6.2" netmask="" type="ipv4"/>
      <flack:interface_info addressUnset="false"/>
    </interface>
    <gemini:node type="mp_node">
      <gemini:services>
        <gemini:active install="yes" enable="yes"/>
        <gemini:passive install="yes" enable="yes"/>
      </gemini:services>
    </gemini:node>
    <services>
      <execute command="sudo /tmp/installer/installer.sh" shell="sh"/>
      <install install_path="/tmp" url="http://www.uky.emulab.net/INSTOOLS/3.5/tarballs/installer.tgz"/>
      <install install_path="/" url="http://www.uky.emulab.net/INSTOOLS/3.5/tarballs/sudoers.tgz"/>
    </services>
    <flack:node_info x="637" y="208" unbound="true"/>
  </node>
  <node client_id="VM-3" exclusive="false" xmlns:rs="http://www.protogeni.net/resources/rspec/ext/emulab/1">
    <rs:vnode name="pcvm62-8"/>
    <sliver_type name="emulab-openvz"/>
    <interface client_id="VM-3:if0">
      <ip address="10.128.3.1" netmask="" type="ipv4"/>
      <flack:interface_info addressUnset="false"/>
    </interface>
    <interface client_id="VM-3:if1">
      <ip address="10.128.5.1" netmask="" type="ipv4"/>
      <flack:interface_info addressUnset="false"/>
    </interface>
    <interface client_id="VM-3:if2">
      <ip address="10.128.6.1" netmask="" type="ipv4"/>
      <flack:interface_info addressUnset="false"/>
    </interface>
    <gemini:node type="mp_node">
      <gemini:services>
        <gemini:active install="yes" enable="yes"/>
        <gemini:passive install="yes" enable="yes"/>
      </gemini:services>
    </gemini:node>
    <services>
      <execute command="sudo /tmp/installer/installer.sh" shell="sh"/>
      <install install_path="/tmp" url="http://www.uky.emulab.net/INSTOOLS/3.5/tarballs/installer.tgz"/>
      <install install_path="/" url="http://www.uky.emulab.net/INSTOOLS/3.5/tarballs/sudoers.tgz"/>
    </services>
    <flack:node_info x="384" y="419" unbound="true"/>
  </node>
  <node client_id="VM-4" exclusive="false" xmlns:rs="http://www.protogeni.net/resources/rspec/ext/emulab/1">
    <rs:vnode name="pcvm62-9"/>
    <sliver_type name="emulab-openvz"/>
    <interface client_id="VM-4:if0">
      <ip address="10.128.1.2" netmask="" type="ipv4"/>
      <flack:interface_info addressUnset="false"/>
    </interface>
    <interface client_id="VM-4:if1">
      <ip address="10.128.2.1" netmask="" type="ipv4"/>
      <flack:interface_info addressUnset="false"/>
    </interface>
    <interface client_id="VM-4:if2">
      <ip address="10.128.5.2" netmask="" type="ipv4"/>
      <flack:interface_info addressUnset="false"/>
    </interface>
    <gemini:node type="mp_node">
      <gemini:services>
        <gemini:active install="yes" enable="yes"/>
        <gemini:passive install="yes" enable="yes"/>
      </gemini:services>
    </gemini:node>
    <services>
      <execute command="sudo /tmp/installer/installer.sh" shell="sh"/>
      <install install_path="/tmp" url="http://www.uky.emulab.net/INSTOOLS/3.5/tarballs/installer.tgz"/>
      <install install_path="/" url="http://www.uky.emulab.net/INSTOOLS/3.5/tarballs/sudoers.tgz"/>
    </services>
    <flack:node_info x="650" y="417" unbound="true"/>
  </node>
  <node client_id="GN" exclusive="false" xmlns:emulab="http://www.protogeni.net/resources/rspec/ext/emulab/1">
    <emulab:routable_control_ip xmlns="http://www.protogeni.net/resources/rspec/ext/emulab/1"/>
    <emulab:vnode name="pcvm62-10" xmlns="http://www.protogeni.net/resources/rspec/ext/emulab/1"/>
    <sliver_type name="emulab-openvz"/>
    <gemini:node type="global_node">
      <gemini:monitor_urn name="urn:publicid:IDN+uky.emulab.net+authority+cm">
    </gemini:monitor_urn></gemini:node>
    <services>
      <execute command="sudo /tmp/installer/installer.sh MC" shell="sh"/>
      <install install_path="/tmp" url="http://www.uky.emulab.net/INSTOOLS/3.5/tarballs/installer.tgz"/>
      <install install_path="/" url="http://www.uky.emulab.net/INSTOOLS/3.5/tarballs/sudoers.tgz"/>
    </services>
    <flack:node_info x="327" y="481" unbound="true"/>
  </node>
  <link client_id="lan0">
    <flack:link_info x="-1" y="-1" unboundVlantag="true" xmlns="http://www.protogeni.net/resources/rspec/ext/flack/1"/>
    <flack:link_info x="-1" y="-1" unboundVlantag="true" xmlns="http://www.protogeni.net/resources/rspec/ext/flack/1"/>
    <interface_ref client_id="VM-2:if0"/>
    <interface_ref client_id="VM-4:if0"/>
    <property source_id="VM-2:if0" dest_id="VM-4:if0"/>
    <property source_id="VM-4:if0" dest_id="VM-2:if0"/>
    <link_type name="lan"/>
    <flack:link_info x="-1" y="-1" unboundVlantag="true"/>
  </link>
  <link client_id="lan1">
    <flack:link_info x="-1" y="-1" unboundVlantag="true" xmlns="http://www.protogeni.net/resources/rspec/ext/flack/1"/>
    <flack:link_info x="-1" y="-1" unboundVlantag="true" xmlns="http://www.protogeni.net/resources/rspec/ext/flack/1"/>
    <interface_ref client_id="VM-4:if1"/>
    <interface_ref client_id="VM-1:if0"/>
    <property source_id="VM-4:if1" dest_id="VM-1:if0"/>
    <property source_id="VM-1:if0" dest_id="VM-4:if1"/>
    <link_type name="lan"/>
    <flack:link_info x="-1" y="-1" unboundVlantag="true"/>
  </link>
  <link client_id="lan2">
    <flack:link_info x="-1" y="-1" unboundVlantag="true" xmlns="http://www.protogeni.net/resources/rspec/ext/flack/1"/>
    <flack:link_info x="-1" y="-1" unboundVlantag="true" xmlns="http://www.protogeni.net/resources/rspec/ext/flack/1"/>
    <interface_ref client_id="VM-3:if0"/>
    <interface_ref client_id="VM-1:if1"/>
    <property source_id="VM-3:if0" dest_id="VM-1:if1"/>
    <property source_id="VM-1:if1" dest_id="VM-3:if0"/>
    <link_type name="lan"/>
    <flack:link_info x="-1" y="-1" unboundVlantag="true"/>
  </link>
  <link client_id="lan3">
    <flack:link_info x="-1" y="-1" unboundVlantag="true" xmlns="http://www.protogeni.net/resources/rspec/ext/flack/1"/>
    <flack:link_info x="-1" y="-1" unboundVlantag="true" xmlns="http://www.protogeni.net/resources/rspec/ext/flack/1"/>
    <interface_ref client_id="VM-1:if2"/>
    <interface_ref client_id="VM-2:if1"/>
    <property source_id="VM-1:if2" dest_id="VM-2:if1"/>
    <property source_id="VM-2:if1" dest_id="VM-1:if2"/>
    <link_type name="lan"/>
    <flack:link_info x="-1" y="-1" unboundVlantag="true"/>
  </link>
  <link client_id="lan4">
    <flack:link_info x="-1" y="-1" unboundVlantag="true" xmlns="http://www.protogeni.net/resources/rspec/ext/flack/1"/>
    <flack:link_info x="-1" y="-1" unboundVlantag="true" xmlns="http://www.protogeni.net/resources/rspec/ext/flack/1"/>
    <interface_ref client_id="VM-3:if1"/>
    <interface_ref client_id="VM-4:if2"/>
    <property source_id="VM-3:if1" dest_id="VM-4:if2"/>
    <property source_id="VM-4:if2" dest_id="VM-3:if1"/>
    <link_type name="lan"/>
    <flack:link_info x="-1" y="-1" unboundVlantag="true"/>
  </link>
  <link client_id="lan5">
    <flack:link_info x="-1" y="-1" unboundVlantag="true" xmlns="http://www.protogeni.net/resources/rspec/ext/flack/1"/>
    <flack:link_info x="-1" y="-1" unboundVlantag="true" xmlns="http://www.protogeni.net/resources/rspec/ext/flack/1"/>
    <interface_ref client_id="VM-3:if2"/>
    <interface_ref client_id="VM-2:if2"/>
    <property source_id="VM-3:if2" dest_id="VM-2:if2"/>
    <property source_id="VM-2:if2" dest_id="VM-3:if2"/>
    <link_type name="lan"/>
    <flack:link_info x="-1" y="-1" unboundVlantag="true"/>
  </link>
</rspec>
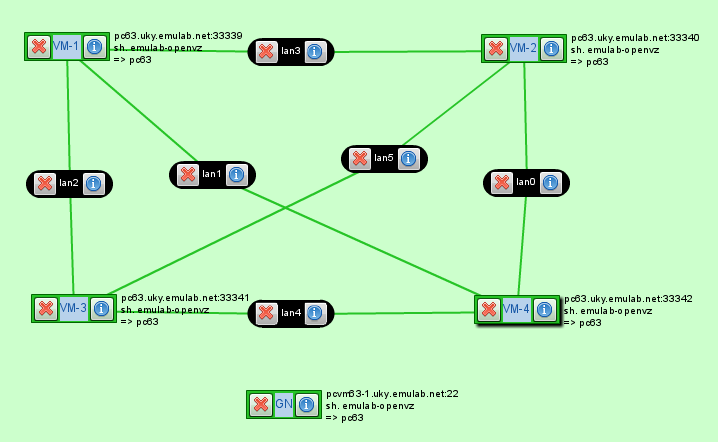
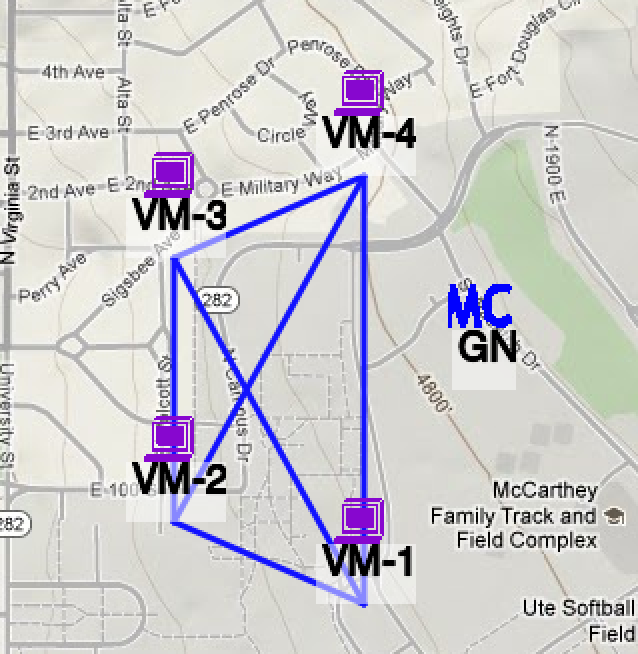
Visually this would look like
2.2) Instrumentize process
Things to verify before instrumenting your slice :
- Know the path to your GENI certificate file
- Know the passphrase for your GENI certificate file. GEMINI currently does not support decrypted/unencrypted GENI certificates. Its easier and less cumbersome if you can store your passphrase in ~/.ssl/password as explained in the User Workspace setup explained earlier.
- The sliver status for your slice is "READY".
- Make sure you can ssh into the nodes in your slice without being prompted for password. This functionality is one of the fundamental and necessary requirements of setting up the GEMINI I&M System on your slice. See instructions for adding your key to the ssh-agent.
- Renew your slice and slivers. Some certificates used in GEMINI are tied to your slice's expiration date and would need to be manually updated if your slice is renewed after the instrumentize process.
In order to instrument your slice using GEMINI we use the script called "instrumentize.py" with the below mentioned parameters
instrumentize.py -f <PATH TO YOUR GENI CREDENTIAL FILE> -n <SLICENAME>
For example, in your User Workspace VM that your are using in this tutorial, do
geni@UserWorkspace:~$ cd ~/Tutorials/GEMINI/commmon/
geni@UserWorkspace:~/Tutorials/GEMINI/commmon$./instrumentize.py -f /path/to/your/geni/credential/file -n some_slice_name
If you are experiencing problems , it is helpful to run the above command with a debug option enabled (- d) like below
geni@UserWorkspace:~/Tutorials/GEMINI/commmon$./instrumentize.py -d -f /path/to/your/geni/credential/file -n some_slice_name
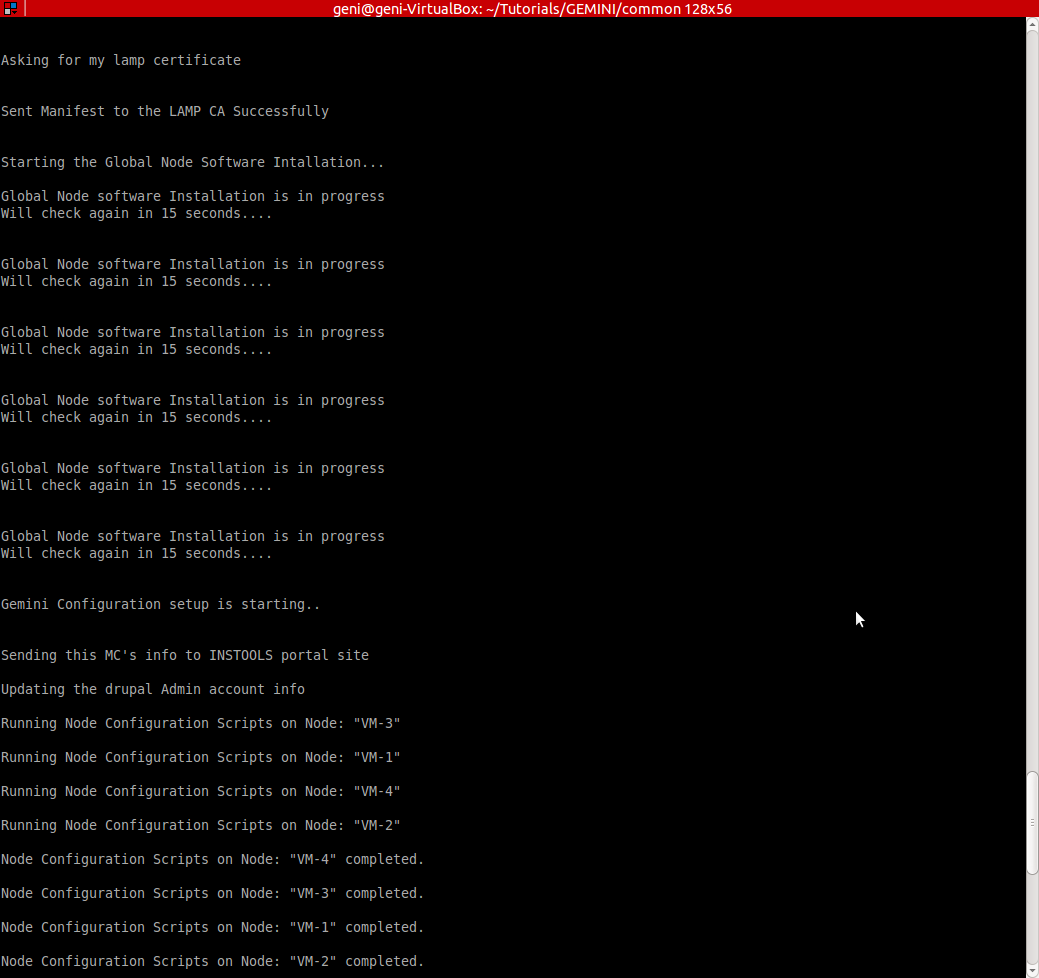
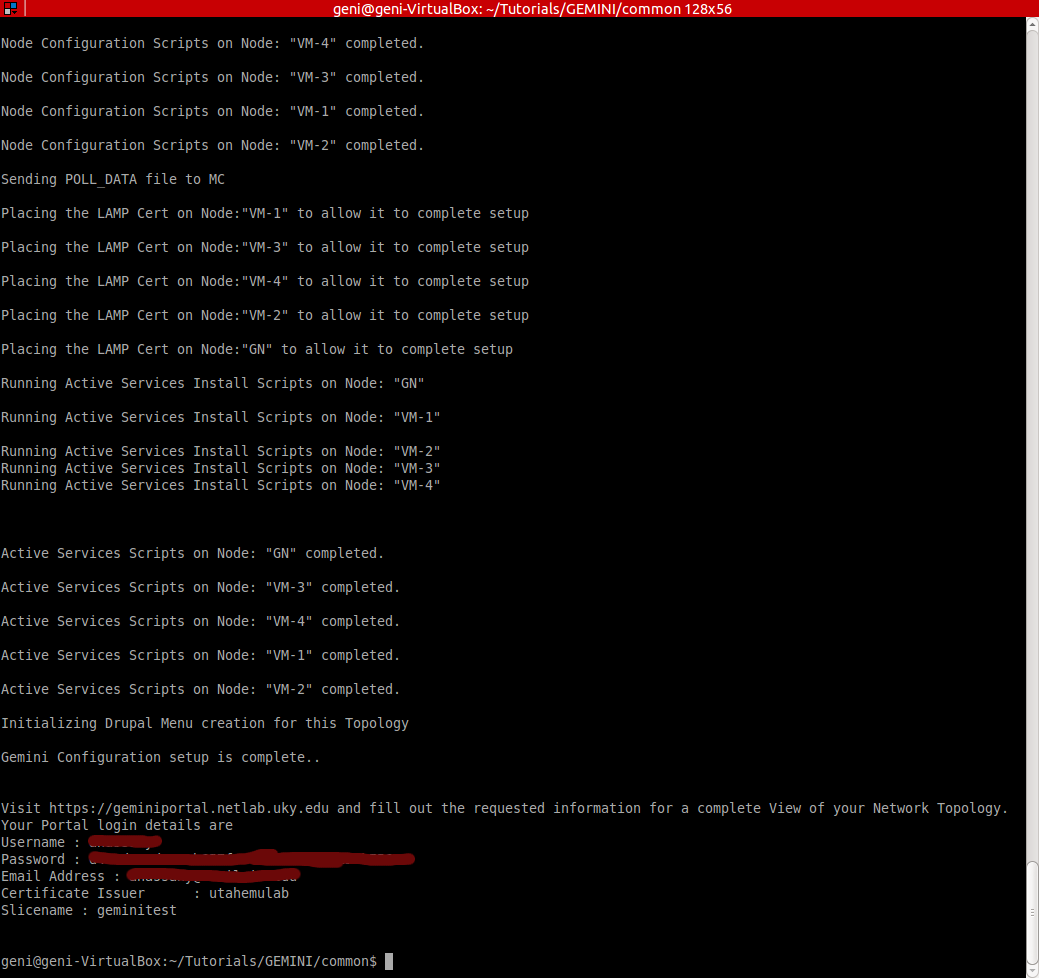
While the instrumentize process is running you will see messages printed out on your terminal informing the action being performed at each stage of the process. In short, the list of steps being performed are
- Check all Nodes to be instrumentized for OS compatibility with the GEMINI Software
- Send your manifest to the UNIS Server (UNIS is mentioned in the GEMINI Documentation)
- Obtain Credential to view Active measurements
- Install all software required for the Passive measurements on the Global Node and Measurement points
- Install all software required for the Active measurements on the Global Node and Measurement points
- Send slice information to the GEMINI Portal
Steps 4 and 5 do take considerable amount of time to complete, hence please be patient. ( currently around 20 minutes on VMs and 10 minutes when using raw nodes )
On successful completion of the instrumentation process you will be given a username,password, link to the geminiportal website, and other information that you may need to login to the geminiportal site (https://geminiportal.netlab.uky.edu/). Please note this information down for use later. Below are screenshots of a GEMINI Instrumentation process and the execution flow of what you would see during this process.
2.3) Confirm slice with installed I&M tools and experiment services
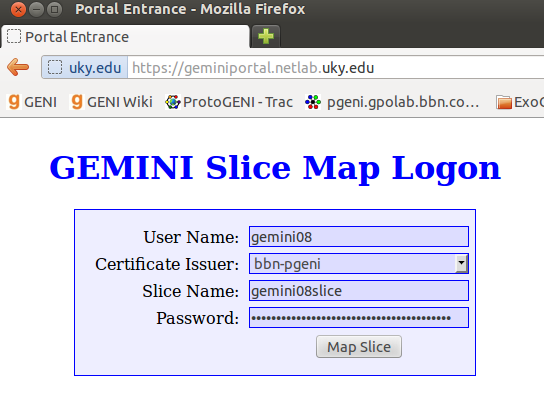
In order to access the GEMINI portal (https://geminiportal.netlab.uky.edu/) use the login information that was given to you after the completion of the GEMINI Instrumentation process. Go to the GEMINI Portal website at https://geminiportal.netlab.uky.edu/
Intro To Gemini Portal
Path Controller
3) Configure I&M tools and experiment services
3.1) Configuring Active Measuremens
The GEMINI I&M system in its current version facilitates regular measurements of throughput, one-way delay and round-trip delay. Other metrics like jitter and loss can also be derived from these measurements.
The GEMINI services on a given node are configured by the pSConfig service. This service reads configuration stored in UNIS as part of the node's topology information and applies it to local configuration files. pSConfig will also start enabled services or stop disabled services that are running.
We will now configure one-way (OWAMP) and round-trip (Ping) latency regular tests between VM1 and VM4.
3.1.1 Accessing pSConfig UI
To configure active measurements we access the pSConfig Web UI. You can find the URL by clicking on the MC node on the GEMINI portal, or by going to https://<gn node>/psconfig.
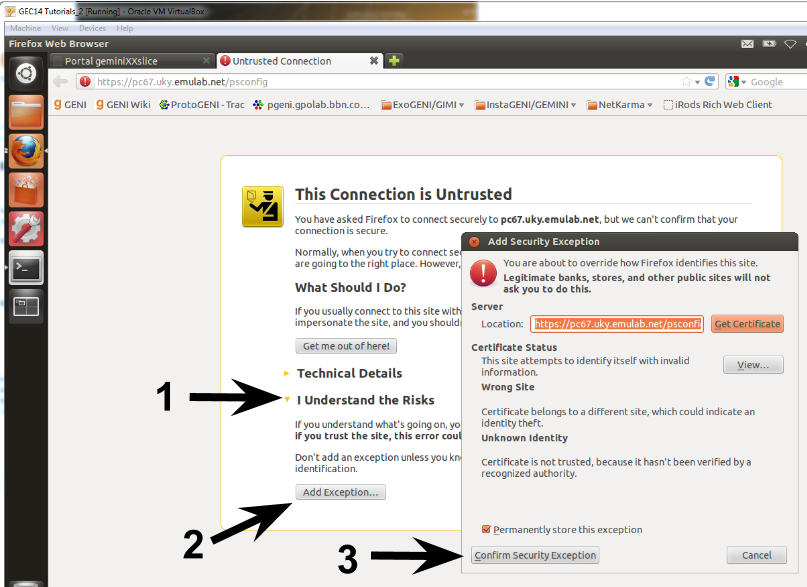
The certificate used by the web server is self-signed, so you will have to add an exception on the browser to proceed.
After adding the exception you should see another pop-up for a certificate request. This time you're providing your user certificate to the service. Make sure the user that is shown for the certificate is the one assigned to you for the tutorial. In this example I'm using the user gemini20. In case you did not see this pop-up or cannot see your user, please redo the steps on User Workspace - Accessing the portal?.
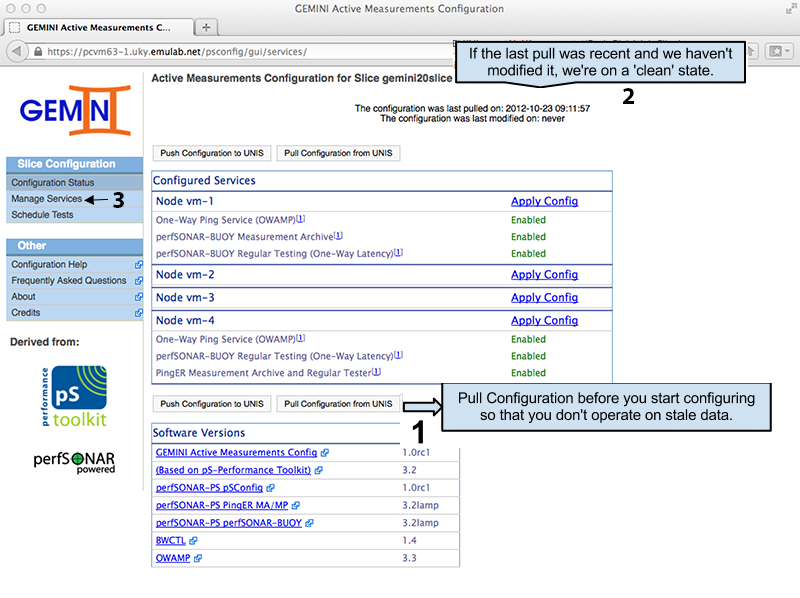
The main page of the pSConfig UI shows what services are currently enabled for each node. It also shows the last time we have synchronized with UNIS (remember that configuration information resides in UNIS). There are other agents that could be changing the information on UNIS, and the pSConfig UI will make sure we don't overwrite changes made since the last pull (i.e. a race condition). It is always a good idea to first pull the current configuration from UNIS before making changes.
3.1.2 Enabling Services
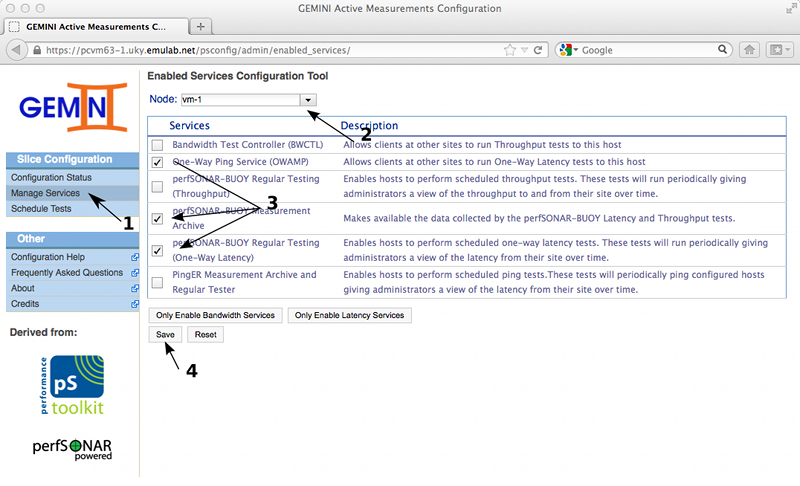
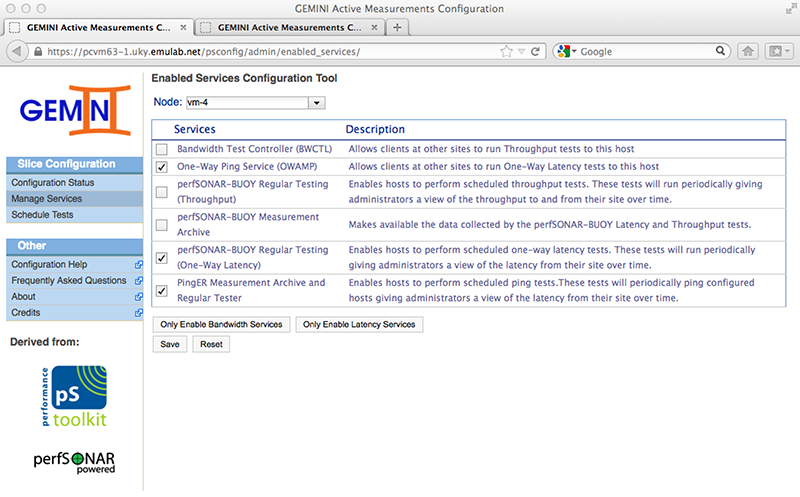
After we've made sure to have a recent copy of the topology information, we can move on to the Manage Services administration page. On this page we will enable the services required to perform on-demand and regularly scheduled tests. We start by enabling the one-way latency services on VM1. Make sure to save the changes before continuing to the next node.
We then proceed to configure the services on node VM4. Since VM4 will receive OWMP probes, we will only enable the daemons for the tools used (owamp). Note that PingER is only enabled on VM4, and we will configure our Ping measurement on that node.
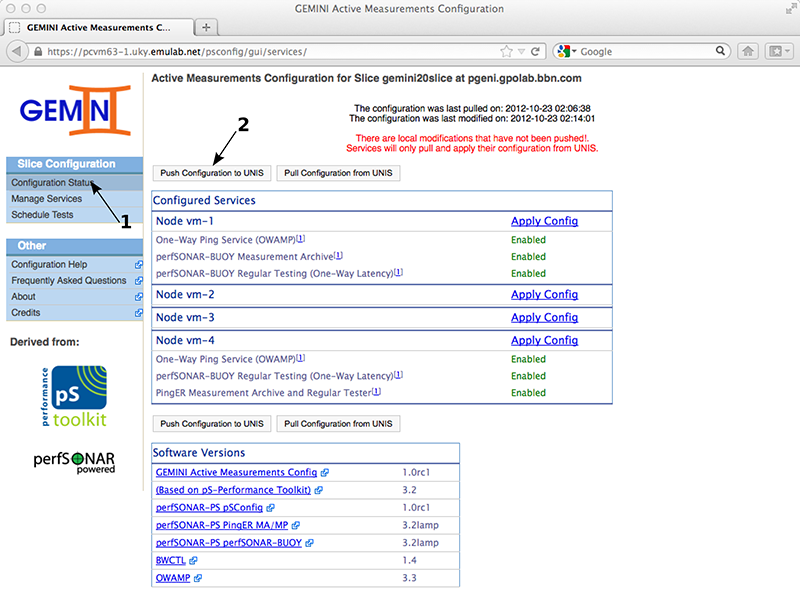
Now that we've enabled the services for our active measurements we will push the configuration to UNIS. To do this we need to go back to the Configuration Status page and then click the Push Configuration to UNIS. You can verify the list of services enabled for each node (i.e. the list in the image should match what you see).
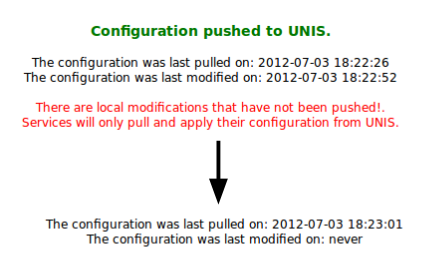
If everything goes well we should see a green message "Configuration pushed to UNIS.". However, the page auto reloads after this, so you might miss it if not paying attention. If there is no error message, the push completed successfully and the modification time will be 'never'.
Success:
Failure (unfortunately, you will have to redo the steps above in the case of a race condition):
3.1.3 Configuring Regular Active Measurements
Enabling the OWAMP and BWCTL daemons is all we need to perform on-demand active measurements. However, it's usually better to have active measurements running regularly to analyze the performance over time. Throughput and ping tests can be scheduled with a given interval (e.g. every 30 minutes). One-way delay tests are scheduled as a stream (a constant amount of packets is sent per second).
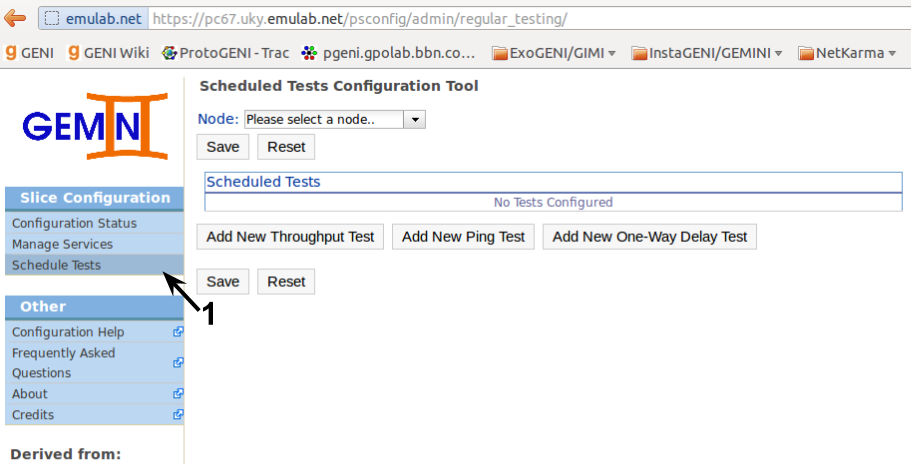
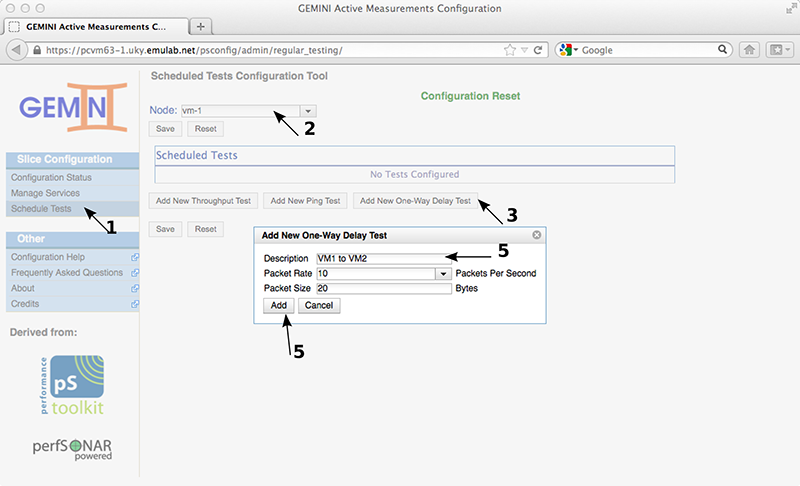
To schedule regular tests we go to the Schedule Tests administration page.
We will schedule OWAMP tests from VM1 to VM4. We could schedule them on either endpoint, as long as both of them are running the appropriate pSBOUY Regular Testing service. In this case we schedule the tests on VM1 by selecting it and adding a new OWAMP test. Clicking the Add New One-Way Delay Test button will pop-up the options to configure the test. The description for the test is only important to you, the services don't use it directly. You can change the packet rate and the packet size used for the test, but we will use the default for the tutorial.
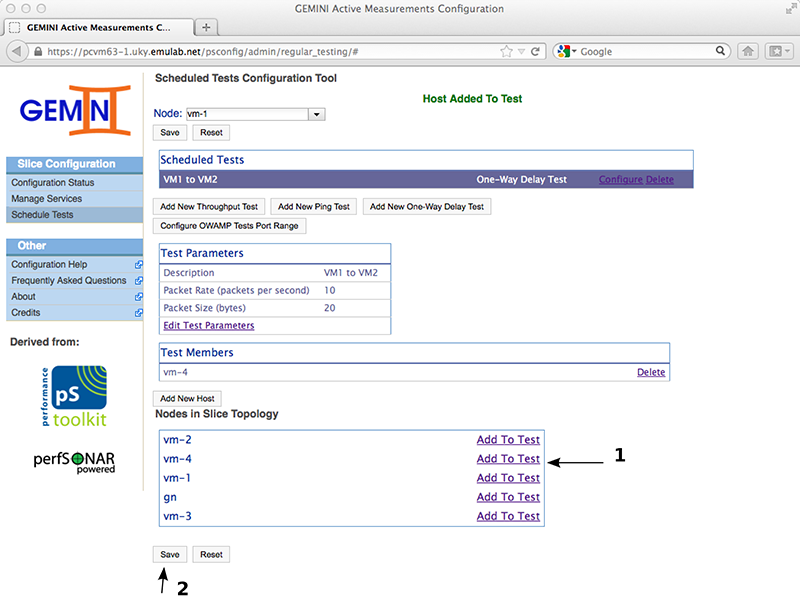
The test we've added establishes the test parameters for a given "star" mesh configuration. We can add multiple targets for this mesh (for OWAMP tests will run in parallel, for BWCTL measurements will be serialized). In this case we add VM4 as a target and save the test.
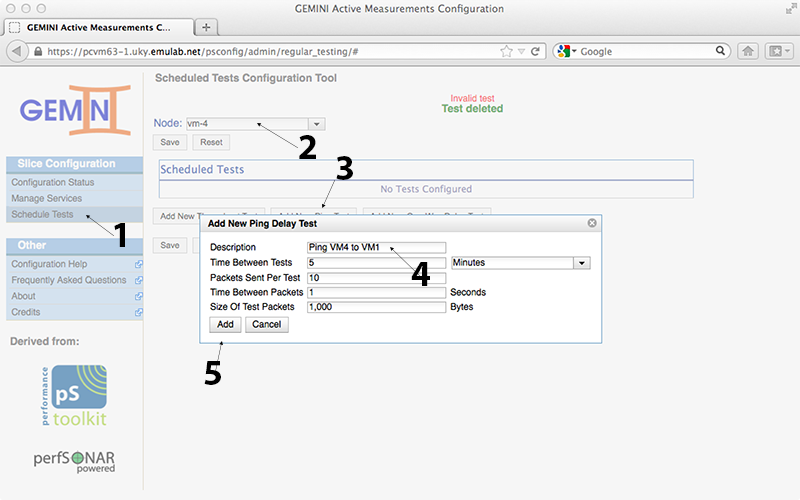
We also add a Ping test between nodes VM4 and VM1, scheduled at node VM4 (this is where we enabled the PingER service).
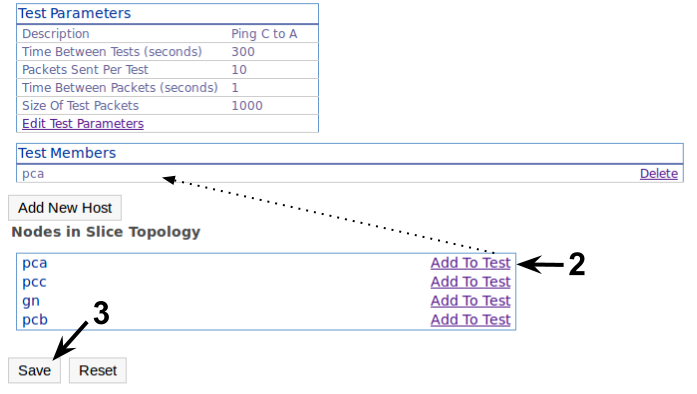
We can configure the standard ping parameters and the description for our test. The default has a relatively large packet size, so keep this in mind when analyzing the latency results (the ideal is to have packets the size of your experiment's packets). After creating the test we need to add our targets (VM1) and save the test. NOTE: You could use the 'Add New Host' button to add hosts outside of the slice (e.g. to ping geni.net).
After adding all these tests we go back to the Configuration Status page and push the configuration to UNIS.
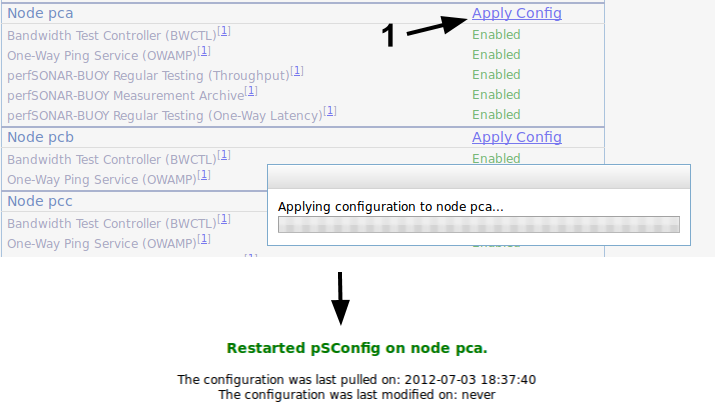
3..14 Applying the Configuration
pSConfig will pull the node's configuration from UNIS every 30 minutes (from the time it was started, not hh:00 and hh:30). Since we don't want to wait this long to start gathering data, we can restart pSConfig on each node by clicking the Apply Config link. This is achieved by ssh'ing to the node and restarting pSConfig, so errors are usually ssh related.
Make sure you apply the configuration on all three nodes. We will now run the user experiment to generate some heavier traffic on the slice before looking at the data.
3.2) Configure selected experiment services
- objectives:
- binds services together to realize overall reference/actual experiment
- configures baseline services
- verifies that they are ready to run
- at completion: configured experiment services, ready to run and process data, which can be observed by I&M services
4) Run and orchestrate I&M services and experiment services to complete run of experiment
4.1) Initial setup: start basic host measurements and basic ping active network measurements
- objectives:
- verify functionality of hosts
- verify topology of slice
- observe measurements with a real-time presentation service
- continue measurements throughout duration of the test/tutorial/experiment
- at completion:
- functionality of hosts and topology of slice has been verified throughout duration of the experiment
4.2) Continuity test: for a limited time, run iperf active network measurements
- objectives:
- verify ability of slice to carry traffic expected from experiment
- observe measurements with a real-time presentation service
- once satisfactory measurements have been observed, stop continuity test
- at completion:
- capability of slice to carry traffic expected from experiment has been verified
4.3) Instrument and run experiment:
- objectives:
- gather measurements during experiment that allow experiment goals to be met
- include desired measurement points within hosts and/or experiment services to instrument test/tutorial/experiment
- begin to run and orchestrate measurement services
- begin to run and orchestrate experiment services
- observe measurements with a real-time presentation service, to verify expected operation of experiment
- collect all measurements for duration of experiment
- stop experiment services, when this run of the experiment has been completed
- stop measurement services
- at completion:
- one run of experiment has been completed
- real-time look at measurements has verified expected operation of experiment
- a full set of measurements has been collected, for later analysis and presentation
- collected measurements have been transferred to storage service, so that slice resources can be released (if desired)
4.4) Store collected measurements and other artifacts from test/tutorial/experiment in storage service
- at completion:
- collected measurements and other artifacts have been transfered to storage service
- collected measurements and other artifacts are available for later analysis
- slice resources can then be released at any time, without loss of any measurements or artifacts
5) Analyze and visualize measurement results after completing run of experiment
- if necessary, retrieve measurement results from archive service
- analyze and format results as desired, for visualization with presentation service
- as appropriate, store analyzed results and/or visualization in storage service
6) Move selected collected measurements and other artifacts from storage service to long-term archive service
- identify archived objects with persistent identifier
- include policy for sharing with others
- allow retrieval for further analysis and visualization
7) Release experiment resources
Attachments (41)
-
Topology.png (34.6 KB) - added by 12 years ago.
Experiment Topology
-
instrumentize.png (21.7 KB) - added by 12 years ago.
Running Instrumentize.py
- Instrumentize_running1.png (93.3 KB) - added by 12 years ago.
- instrumentize_running2.png (113.3 KB) - added by 12 years ago.
- s6.png (43.8 KB) - added by 12 years ago.
- perfadmin-owampsingle.png (148.8 KB) - added by 12 years ago.
- perfadmin-pinger.png (228.3 KB) - added by 12 years ago.
- perfadmin-psbpca.png (148.8 KB) - added by 12 years ago.
- perfadmin-pull.png (104.9 KB) - added by 12 years ago.
- psconfig-apply.png (48.5 KB) - added by 12 years ago.
- psconfig-main.png (150.9 KB) - added by 12 years ago.
- psconfig-managepcbpcc.png (172.8 KB) - added by 12 years ago.
- psconfig-managepush.png (189.9 KB) - added by 12 years ago.
- psconfig-managepushfailure.png (39.3 KB) - added by 12 years ago.
- psconfig-managepushsuccess.png (50.5 KB) - added by 12 years ago.
- psconfig-schedule-pcacreate.png (87.1 KB) - added by 12 years ago.
- psconfig-schedule-pcasave.png (89.2 KB) - added by 12 years ago.
- psconfig-schedule-pccowd.png (85.0 KB) - added by 12 years ago.
- psconfig-schedule-pccping-add.png (100.1 KB) - added by 12 years ago.
- psconfig-schedule-pccping-save.png (52.5 KB) - added by 12 years ago.
- psconfig-schedule.png (99.4 KB) - added by 12 years ago.
- psconfig-usercert.png (122.0 KB) - added by 12 years ago.
- psconfig-secexception.png (174.5 KB) - added by 12 years ago.
- psconfig-schedule-push.png (78.7 KB) - added by 12 years ago.
- psconfig-portal.png (169.6 KB) - added by 12 years ago.
- psconfig-managepca.png (168.2 KB) - added by 12 years ago.
- psconfig-managevm1.png (92.2 KB) - added by 12 years ago.
- 1-vm1-config.png (198.3 KB) - added by 12 years ago.
- 2-vm4-config.png (199.5 KB) - added by 12 years ago.
- 2.0-unis-push.png (184.9 KB) - added by 12 years ago.
- 4-owamp-vm1-vm4-config.png (117.7 KB) - added by 12 years ago.
- 6-owamp-vm1-vm4-config.png (138.0 KB) - added by 12 years ago.
- 0-unis.png (223.9 KB) - added by 12 years ago.
- 8-pinger-vm4-vm1-config.png (135.6 KB) - added by 12 years ago.
- 09-pinger-vm4-vm1-config.png (156.3 KB) - added by 12 years ago.
- 10-unis-push.png (82.8 KB) - added by 12 years ago.
- 11-psconfig-apply.png (162.8 KB) - added by 12 years ago.
- perfadmin-portal.png (486.4 KB) - added by 12 years ago.
- perfadmin-services.png (182.4 KB) - added by 12 years ago.
- perfadmin-vm1.png (327.8 KB) - added by 12 years ago.
- perfadmin-owampgraph.png (145.8 KB) - added by 12 years ago.

