| Version 3 (modified by , 10 years ago) (diff) |
|---|
Navigation: Up
View Global Node: View and control detailed information available on the Global Node (GN)
Overview
The goal of this exercise is to introduce you to what the GENI Desktop and GEMINI refer to as that Global Node (GN). The GN is an extra node (VM) that is automatically added to your slice when you select the GEMINI extensions in Flack (or manually add the GEMINI extensions into an RSPEC). The purpose of the GN is to be the collection point for all instrumentation and measurement data collected by the slivers. Since slivers may be in different aggregates, there is one GN per aggregate. Each GN only collects data from slivers in its aggregate. This localizes communication, thereby minimizing interference of the I&M data collection mechanism with the running experiment. It also provides a centralized location(s) where users can go to find detailed information coming from the slivers in an aggregate.
In this exercise you will use the GENI Desktop to connect to the GN and view additional live graphs and tables not directly available via the passive graphs view used in the previous exercise. You will also be shown how to view detailed packet captures using wireshark. Lastly, you will learn to X-based applications, and configure the data collection.
NOTE : In order to run xterm and wireshark, you need to have a working java plugin installed in your browsers. Without a properly setup java plugin, you will not see these tools working.
Access a Global Node
In order to access global node information, click the launcher  icon and select the Global Node items from
the launcher menu
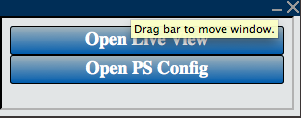
  . This will create a button
  that will allow you to see or configure global nodes.
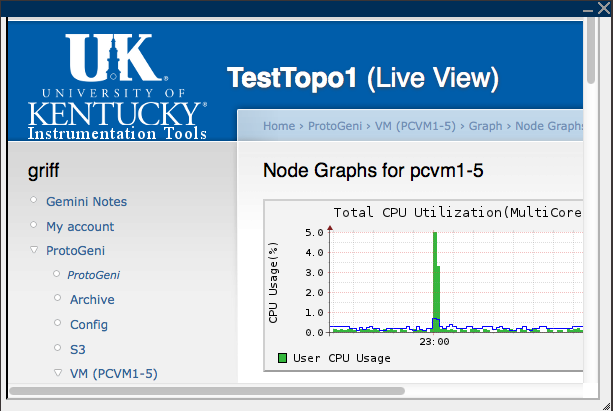
A topology may have multiple Global Nodes (GNs), one per aggregate. Although the GNs appear in the logical and geographic views of the topology, it is not immediately obvious which slivers (nodes) are managed by each of the GNs. Consequently, to find the GN for any particular node in the topology, one can select the desired sliver (node) and then click on the live view button. This will bring up a live view window (see below).
Viewing packet traces
(NOTE: This does not work in Google Chrome due to goolge removing JAVA support from the browser)
To view packet traffic traces, you can run the wireshark application on a node to capture and display packet traces. To launch wireshark on a node, open up the node's menu item (on the left in the live view window). Select the VNC link. You will be presented with the option to run wireshark or to run an xterm. Select wireshark which will generate a list of log messages and then will open the wireshark in an X-window. You can then run wireshark as normal.
Access X-based Applications
You can run any X-based application on your VM nodes by selecting VNC and then selecting xterm. This will
open up an xterm on an X-window display (all inside your browser). You can then run any X-window application
from the xterm.
Configure and Manage the GN(s)
To configure which data the GENI Desktop collects by default, click on the "Config" link in the live view's menu on the left hand side and then select "Configure Data Collection & Display Settings".
Exercise Tasks
- Task 1: Bring up a window to view the GN.
- Task 2: Find the routing table for VM-1.
- Task 3: Bring up wireshark and capture all packets flowing between VM-0 and VM-2.


