| Version 7 (modified by , 10 years ago) (diff) |
|---|
Navigation: Up
Exercise: Viewing Traffic
Instructions
The goal of this exercise is to give you practice using the GENI Desktop to login into your nodes (ssh), start up iperf (to generate traffic), and then view the traffic. There are no step by step instructions. Instead, we begin by describing general concepts and procedures needed to use the GENI Desktop, and then provide you with a set of tasks that you must complete. In the process of completing these tasks, you will gain an understanding of how to interact with and control the GENI Desktop and GEMINI.
Ssh'ing into nodes from the GENI Desktop
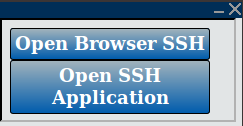
To open an ssh session, you must first launch the ssh tool. You can launch the ssh tool by clicking the launch icon  in the upper lefthand corner of the GENI Desktop and then selecting ssh. This will create an ssh button
  near the task bar on the bottom. To ssh into nodes, select the node in the topology by left-clicking on the node. Once selected, press the ssh button to ssh into your network. You may need to accept the security certificate if prompted by your browser. You can iconify the ssh button or deiconify the ssh button by clicking ssh in the task bar.
Viewing traffic from the GENI Desktop
We have two modules to view traffic You can use either one.
Passive Graphs Lite
This provides you a basic view of the graphs that is set in a view only mode and provides no control over pausing the live view or zoom in/zoom out . To view traffic with this view, click on the launcher icon
and select "Passive Graphs Lite". This will create a graph selection window (see below) on your screen. By default, the CPU, ICMP, and IP graphs are selected. Adjust the selection to the graphs you want to see. Select the node or nodes in the topology for which you would like to see graphs. Then click the "add graphs" button. If you have selected multiple nodes, you may prefer to click on "add graphs with titles," as this will clearly identify the node from which the graph is taken. Like the ssh box, you can iconify or deiconify the graph selection box by clicking on the task bar.
Passive Graphs
This provides you an enhanced view of the graphs with control over pausing the live view, zoom in/zoom out, viewing data points and setting alerts when a user specified min/max values is observed. To view traffic with this view, Select the node or nodes in the topology for which you would like to see graphs. Then click on the launcher icon
and select "Passive Graphs". Like the ssh box, you can iconify or deiconify the graph selection box by clicking on the task bar.
NOTE: If you do not see any/either of the module, please see here to add the module to your viewable list.
Generating traffic with iperf
The iperf program can be used to generate traffic. Iperf needs to be run on both the source and destination node. Iperf should first be started at the destination in server mode using the command "iperf -s." To run iperf on the source, type "iperf -t 60 -b 100M -c destination" where destination is the IP address (or name) of the node where the iperf server is running. This will tell iperf to generate traffic for sixty seconds, sending at a rate of one hundred megabits per second. The names of the hosts in your topology can be found in the /etc/hosts.
Exercise Tasks
- Task 1: Ssh into VM-0 and VM-1.
- Task 2: Use iperf to generate traffic between VM-0 and VM-1.
- Task 3: View the traffic between VM-0 and VM-1.

