| Version 13 (modified by , 10 years ago) (diff) |
|---|
Navigation: Up
BLiPP and NetLogger: Access active measurement probe data
Overview
The goal of this exercise is to configure BLiPP (Basic Lightweight Periscope Probes) and enable active measurements within your slice. An example NetLogger script will be used to generate data that will be collected with an active BLiPP probe. A final exercise will use a NetLogger wrapper library to instrument an existing application.
The role of BLiPP
BLiPP is a measurement agent that runs on every GEMINI experiment node within your slice. Through a web interface and/or command line, you can configure BLiPP to collect both passive and active measurements from the given node. BLiPP retrieves its configuration from a central information store known as UNIS, the contents of which we update through the configuration interfaces. BLiPP will then store measurement data to a measurement store (MS) running on the GEMINI global node within your slice. Each measurement is associated with one or more "event types" that identify what metric(s) are collected for a given measurement. These event types are displayed in a drop down box next to the configured measurements with an option for graphing the collected data.
Configure BLiPP measurements
From the GENI Desktop page, click on the  and then select 'GEMINI GN' from
  . Select 'Open PS Config' from the new GN window:
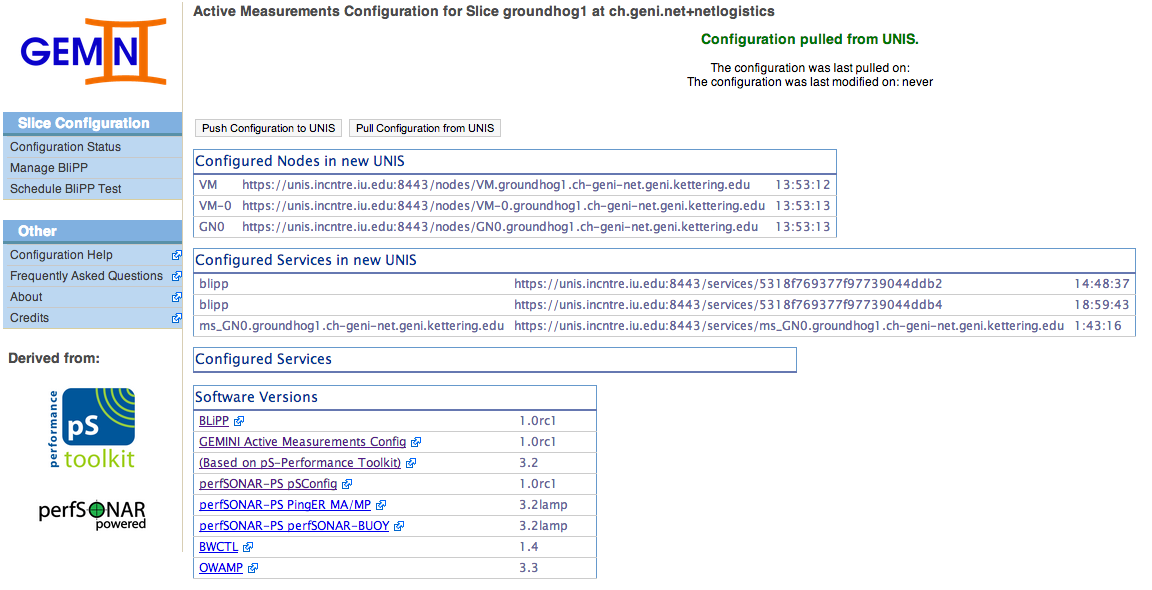
You should then see a page similar to the below image. Select 'Schedule BLiPP Test' from the menu.
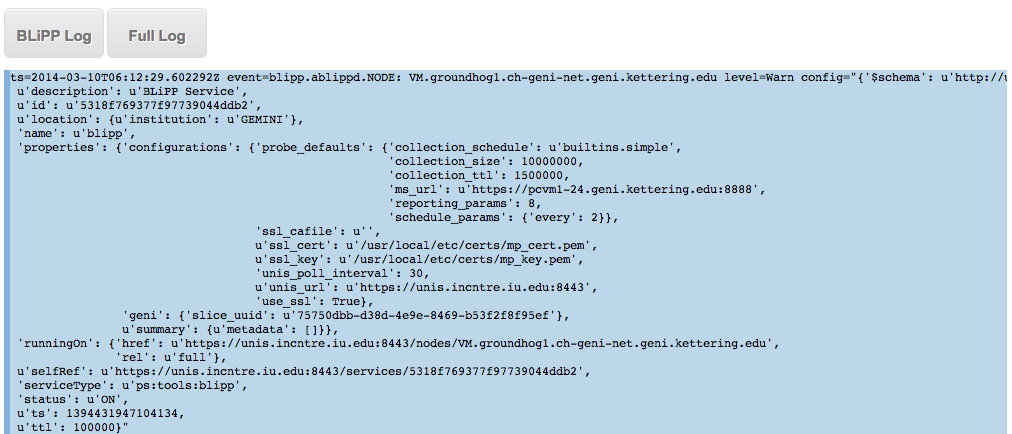
From the 'Schedule BLiPP Test' page click 'BLiPP Log' to see that a BLiPP instance is running.
Select a node to configure from the dropdown menu 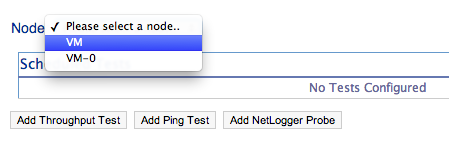 , then select an active test to configure.
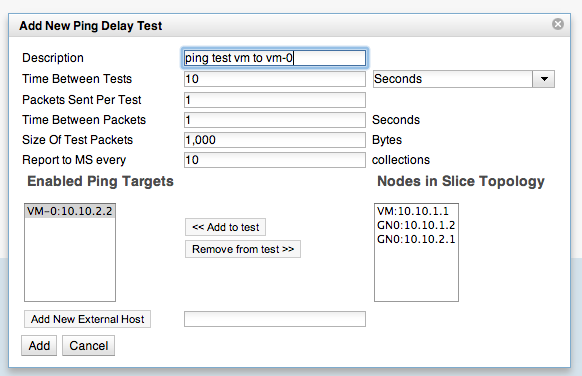
For example, below we configure a ping test. At the moment, only a single target may be configured per test. You can also add external hosts (i.e., outside of the slice) to ping by entering an IP or hostname in the text box.
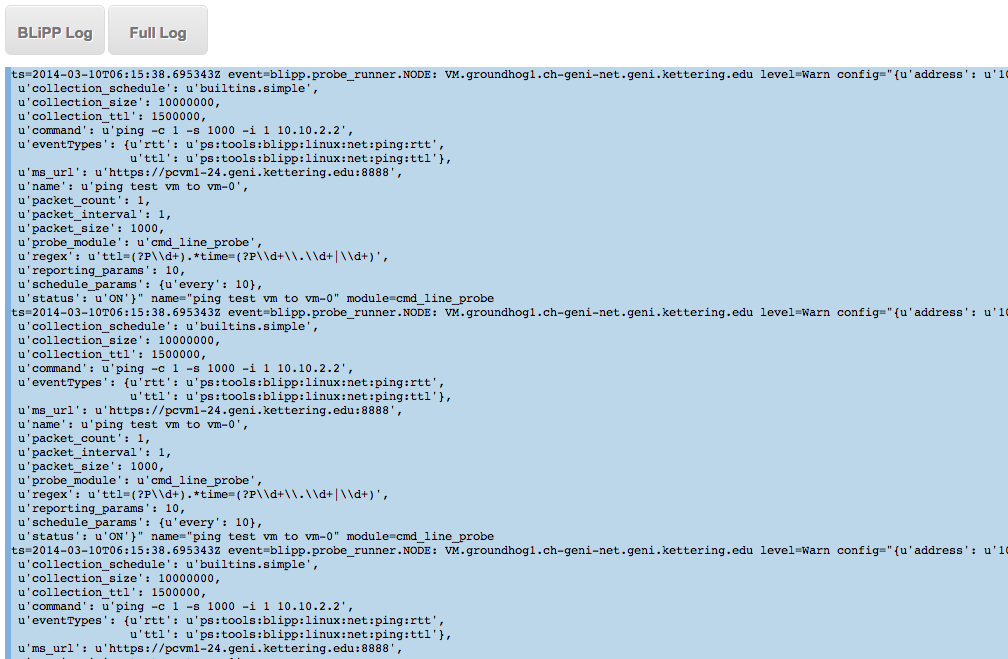
Once configured, BLiPP will poll UNIS, update its configuration, and begin collecting the desired measurements. The scheduled measurement will be seen below in the log by clicking the 'BLiPP Log' button. Be sure to click the 'BLiPP Log' button as you schedule new tests. If you would like a bigger view, click the 'Full Log' button. The event types for each measurement will be displayed alongside each scheduled test row. Once data is available (give it a few minutes to begin collecting!), you can select an event type and display the associated graph.
NOTE: For throughput testing, no assumption is made about listening servers. For example, an iperf test will attempt to connect to the specified host at each interval, but if no iperf server is listening, no result will be collected. Future work will allow BLiPP to start a throughput listener on another node within the slice.
Using NetLogger
NetLogger is a set of software tools that can be used to log application events and perform analysis and debugging of the collected log data. The python netlogger tools and libraries are installed on your slice nodes by default with GEMINI. More details and software can be obtained from the NetLogger website http://netlogger.lbl.gov/
An application instrumented with NetLogger can output log messages to a file in a standardized format. BLiPP has a netlogger probe that can parse this log file and report the measurements to the measurement store on your global node. In this way, measurement data collected from experiments in your slice will be in the same format as the other GEMINI measurements. This also means they are accessible in a common location and will be archived to iRODS along with any other measurements collected through the GEMINI system.
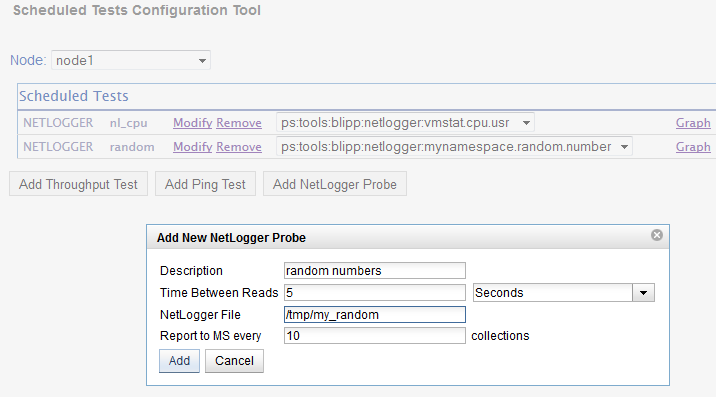
To configure a NetLogger probe, you simply add another BLiPP test as shown below.
Specify the file on the given node where you are collecting NetLogger log messages. BLiPP will then check the file for new messages on the specified interval and report the collected values to the measurement store.
The event type(s) for NetLogger probes depend on what is found in the log messages. Since they are defined by the programmer, BLiPP does not know about them until it begins parsing the log file. Once data is available, BLiPP will update the measurement information and display the event types in the drop down next to the scheduled test. Give it a few minutes and then refresh the page. Once the event types appear, you can select 'Graph' and display a graph of the collected measurements from the log file. The following exercise will ask you to use NetLogger on your experiment node and collect the measurement data with BLiPP.
Exercise Task 1 -- Python !NetLogger
For the following exercise, if you do not have your own source code that you want to try and instrument with NetLogger, you can simply use the following netlogger_test.py program.
#!/usr/bin/python
import sys
import logging
import time
import random
from netlogger.nllog import get_logger
from netlogger import nlapi, nllog

log = nllog.get_logger(".mynamespace")
handler = logging.StreamHandler(sys.stdout)
log.addHandler(handler)
log.set_meta(host=nlapi.get_host())
log.setLevel(logging.INFO)

while True:
    log.info("random.number", VAL=random.random())
    time.sleep(1)
- Task 1: Upload the NetLogger application/script to one of your experiment nodes.
- Task 2: Execute the application on the node. For example:
./netlogger_test.py > /tmp/my_random
- Task 3: Configure a NetLogger probe to read the log file and graph the measurements.
Exercise Task 2 -- Instrument existing application
In this exercise, we will make use of a transparent NetLogger wrapper than can intercept standard socket calls in existing applications. This includes read()/write() and send()/recv(). When using the wrapper, you can specify an output file where the log messages are stored as well as the summary interval. The wrapper uses a version of NetLogger called NL-Calipers, which calculates and stores in-memory summary statistics over each event encountered. The NL_INTERVAL variable determines how frequently those summary statistics are reported and the counters reset.
The NetLogger probe instructions above can be used to let BLiPP push the collected NL-Calipers measurements into the measurement store (MS) for graphing and archiving as we did in the previous exercise. We will use 'iperf' as our test application to instrument with the wrapper library. The iperf program should already be installed on the GEMINI intrumentized node. If not, you can 'yum install iperf' or select another application to test with. The following is an example of how to enable the wrapper using the Linux LD_PRELOAD mechanism (assumes default csh on default Fedora 15 images).
setenv LD_PRELOAD /usr/local/lib/nl_wrapper.so
setenv NL_INTERVAL 1     # default is 1 second summaries
setenv NL_FILE /tmp/iperf.log

iperf -c VM-0 -t 120 -i 2
------------------------------------------------------------
Client connecting to VM-0, TCP port 5001
TCP window size: 49.7 KByte (default)
------------------------------------------------------------
[  4] local 10.10.1.1 port 49730 connected with 10.10.1.1 port 5001
[ ID] Interval       Transfer     Bandwidth
[  4]  0.0- 2.0 sec  5.65 GBytes  24.3 Gbits/sec
[  4]  2.0- 4.0 sec  6.48 GBytes  27.8 Gbits/sec
[  4]  4.0- 6.0 sec  6.22 GBytes  26.7 Gbits/sec
[  4]  6.0- 8.0 sec  6.74 GBytes  29.0 Gbits/sec
...

tail -f /tmp/iperf.log
ts=2014-03-12T02:44:40.734545Z event=wrapper.calipers.write v.sum=2496921600.000000 v.min=131072.000000 v.max=131072.000000 v.mean=131072.000000 v.sd=0.000000 r.sum=63101.880412 r.min=0.000654 r.max=5.041231 r.mean=3.312435 r.sd=0.628077 g.sum=7558.227539 g.min=0.198364 g.max=1528.854370 g.mean=0.396757 g.sd=11.074916 count=19050 dur=1.000013 dur.i=0.990672
ts=2014-03-12T02:44:41.734688Z event=wrapper.calipers.write v.sum=3468034048.000000 v.min=131072.000000 v.max=131072.000000 v.mean=131072.000000 v.sd=0.000000 r.sum=94498.685749 r.min=0.612486 r.max=5.041231 r.mean=3.571514 r.sd=0.395003 g.sum=7539.329529 g.min=0.198364 g.max=1.632690 g.mean=0.284944 g.sd=0.050552 count=26459 dur=1.000008 dur.i=0.988195
ts=2014-03-12T02:44:42.734783Z event=wrapper.calipers.write v.sum=3484024832.000000 v.min=131072.000000 v.max=131072.000000 v.mean=131072.000000 v.sd=0.000000 r.sum=94586.291226 r.min=0.217728 r.max=4.854519 r.mean=3.558417 r.sd=0.267479 g.sum=7536.308289 g.min=0.205994 g.max=4.592896 g.mean=0.283522 g.sd=0.048784 count=26581 dur=1.000032 dur.i=0.987799
ts=2014-03-12T02:44:43.734906Z event=wrapper.calipers.write v.sum=3365928960.000000 v.min=131072.000000 v.max=131072.000000 v.mean=131072.000000 v.sd=0.000000 r.sum=89386.429279 r.min=0.422813 r.max=4.854519 r.mean=3.480780 r.sd=0.440131 g.sum=7541.175842 g.min=0.205994 g.max=2.365112 g.mean=0.293659 g.sd=0.055629 count=25680 dur=1.000017 dur.i=0.988437
...
Once a BLiPP test has been configured for the given node, the event type drop down will contain entries for each of the statistics recorded by the NetLogger wrapper. (You will need to wait a minute for the collection to start and then refresh the page.) In the iperf case, the client performs a number of write() calls to send data to the server.
Note that any additional applications started from a shell with the LD_PRELOAD environment variable set will invoke the intercept methods in the wrapper library.
Here is a summary of each statistic:
- - sum
- - mean
- - min
- - max
- - standard deviation.
- These statistics are tracked for:
- - 'v': the recorded value
- - 'g': the ratio of the duration(ns)/value (prefix=g for gap)
- - 'r': the ratio of the value/duration(ns) (prefix=r for rate)

