
- Basic Experiment with GEMINI v1.0 I&M Tools: Instructions
Basic Experiment with GEMINI v1.0 I&M Tools: Instructions
1. Prerequisites
- To prepare for the tutorial, each participant should install VirtualBox and the Tutorial VM image on their computer.
Instruction for this step can be found here: GEC14TutorialVMInstructions
- You should have attended the InstaGENI tutorial given right before the GEMINI tutorial.
- For the tutorial given at GEC14, the slices will be pre-made and instrumentized. The information for the slice will be given to you on an info sheet and you can also find your information here. Make sure you are accessing your slice!
2. Overview
The instructions on this page are designed for the GEMINI Tutorial at GEC 14. This tutorial covers how to instrumentize a GENI slice using the GEMINI I&M system.
The GEMINI I&M system provides an easy way to instrumentize a GENI slice with passive and active measurements. The current version of GEMINI provides host monitoring metrics (cpu, memory, network) and tools to perform on-demand and regular active measurements for throughput, one-way latency and round-trip latency (both with jitter and loss).
Users can specify through their request RSpec which nodes should have passive instrumentation (e.g. host monitoring) and which nodes should active measurement services installed. While most passive instrumentation is always on, active measurements must be configured by the user. This is done through a web interface available on a instrumentized slice. A key service for this to work in GEMINI is UNIS: Unified Network Information Service.
UNIS and Topology-based Configuration: The Unified Network Information Service (UNIS) is the most important
component of the GEMINI architecture. For those familiar with perfSONAR, this service is the combination of
the Lookup Service and the Topology Service of the perfSONAR framework. UNIS stores the topology data of GENI
slices, and services register themselves so that they can be found dynamically. The configuration of the
active measurement services is done through annotations on the topology data. A web interface is provided to
configure the active measurements and push the configuration to UNIS.
In this tutorial you will learn all the steps necessary to fully utilize the GEMINI I&M system, from instrumentizing and bootstrapping your slice to configuring measurements to visualizing and archiving the data.
3. User Workspace
The User Workspace is an environment that contains all of the tools and configuration necessary to set up your slice and install and configure the GEMINI instrumentation and measurement tools. These tools include:
- GEMINI
- /home/geniuser/Tutorials/GEMINI/common
- The GEMINI tools and the rspec used in the tutorial (gec14.xml)
- /home/geniuser/Tutorials/GEMINI/common
- OMNI
- Version 1.6.2 installed in /opt/gcf
More information about the User Workspace can be found at http://groups.geni.net/geni/wiki/GENIUserWorkspace.
Before configuring your slice, you will need to configure a few things for your user by following these instructions.
After GEC14, you can configure your own GENI credentials according to the Configuring Credentials instructions.
4. Setting up RSpec for GEMINI
In order to use the GEMINI I&M system to instrument your slice, you have to add GEMINI specific rspec extensions to your slice. This can be done at the time you create your rspec. The GEMINI I&M system requires that you add an extra raw-pc node into your slice that we call as the GLOBAL Node. This node does not need to have any links to any other nodes in your slice.
To designate a node as a GLOBAL Node add the following section in the node section of the rspec as shown below
<gemini:node type="global_node">
        <gemini:monitor_urn name="urn:publicid:IDN+uky.emulab.net+authority+cm"/>
</gemini:node>
The monitor-urn tag defines which Aggegate's Node this Global Node is supposed to monitor. In our example above, this node is supposed to monitor the nodes at the Kentucky Aggregate.
All other nodes (raw-pc or virtual nodes) to be monitored using GEMINI should be designated with a GEMINI rspec extension that defines them as a MP Node (measurement point node) as shown below
<gemini:node type="mp_node">
        <gemini:services>
                <gemini:active install="yes" enable="yes" />
                <gemini:passive install="yes" enable="yes" />
        </gemini:services>
</gemini:node>
For each MP node you also have to define if you would like to have active or passive monitoring installed and/or enabled . The above snippet requests that both active and passive monitoring be installed and enabled on the node.
Using the above mentioned GEMINI rspec extensions along with its xmlns schema definition in the rspec (xmlns:gemini="http://geni.net/resources/rspec/ext/gemini/1"), you can create a Slice which can later be instrumentized using GEMINI. For example, our Tutorial topology rspec would look like
<rspec xmlns:client="http://www.protogeni.net/resources/rspec/ext/client/1" xmlns:xsi="http://www.w3.org/2001/XMLSchema-instance" xmlns="http://www.geni.net/resources/rspec/3"
xmlns:gemini="http://geni.net/resources/rspec/ext/gemini/1" type="request" xsi:schemalocation="http://www.geni.net/resources/rspec/3 http://www.geni.net/resources/rspec/3/manifest.xsd ">
        <node xmlns:gemini="http://geni.net/resources/rspec/ext/gemini/1" client_id="GN" component_manager_id="urn:publicid:IDN+uky.emulab.net+authority+cm" exclusive="true">
                <sliver_type name="raw-pc">
                        <disk_image name="urn:publicid:IDN+uky.emulab.net+image+emulab-ops//UBUNTU10-STD"/>
                </sliver_type>
                <hardware_type name="pcfast"/>
                <gemini:node type="global_node">
                        <gemini:monitor_urn name="urn:publicid:IDN+uky.emulab.net+authority+cm">
                </gemini:monitor_urn></gemini:node>
        </node>
        <node xmlns:gemini="http://geni.net/resources/rspec/ext/gemini/1" client_id="PCA" component_manager_id="urn:publicid:IDN+uky.emulab.net+authority+cm" exclusive="false">
                <sliver_type name="emulab-openvz"/>
                <interface client_id="PCA:if0"/>
                <gemini:node type="mp_node">
                        <gemini:services>
                                <gemini:active install="yes" enable="yes"/>
                                <gemini:passive install="yes" enable="yes"/>
                        </gemini:services>
                </gemini:node>
                <services>
                        <execute shell="sh" command="wget -q -P /tmp http://gemini.netlab.uky.edu/phoebus_install.sh;chmod +x /tmp/phoebus_install.sh;sudo /tmp/phoebus_install.sh"/>
                </services>
        </node>
        <node xmlns:gemini="http://geni.net/resources/rspec/ext/gemini/1" client_id="PCB" component_manager_id="urn:publicid:IDN+uky.emulab.net+authority+cm" exclusive="false">
                <sliver_type name="emulab-openvz"/>
                <interface client_id="PCB:if0" />
                <interface client_id="PCB:if1" />
                <gemini:node type="mp_node">
                        <gemini:services>
                                <gemini:active install="yes" enable="yes"/>
                                <gemini:passive install="yes" enable="yes"/>
                        </gemini:services>
                </gemini:node>
                <services>
                        <execute shell="sh" command="wget -q -P /tmp http://gemini.netlab.uky.edu/phoebus_install.sh;chmod +x /tmp/phoebus_install.sh;sudo /tmp/phoebus_install.sh gateway"/>
                </services>
        </node>
        <node xmlns:gemini="http://geni.net/resources/rspec/ext/gemini/1" client_id="PCC" component_manager_id="urn:publicid:IDN+uky.emulab.net+authority+cm" exclusive="false">
                <sliver_type name="emulab-openvz"/>
                <interface client_id="PCC:if0"/>
                <gemini:node type="mp_node">
                        <gemini:services>
                                <gemini:active install="yes" enable="yes"/>
                                <gemini:passive install="yes" enable="yes"/>
                        </gemini:services>
                </gemini:node>
                <services>
                        <execute shell="sh" command="wget -q -P /tmp http://gemini.netlab.uky.edu/phoebus_install.sh;chmod +x /tmp/phoebus_install.sh;sudo /tmp/phoebus_install.sh"/>
                </services>
        </node>
        <link client_id="lan0">
                <interface_ref client_id="PCA:if0"/>
                <interface_ref client_id="PCB:if0"/>
        </link>
        <link client_id="lan1">
                <interface_ref client_id="PCB:if1"/>
                <interface_ref client_id="PCC:if0"/>
        </link>
</rspec>
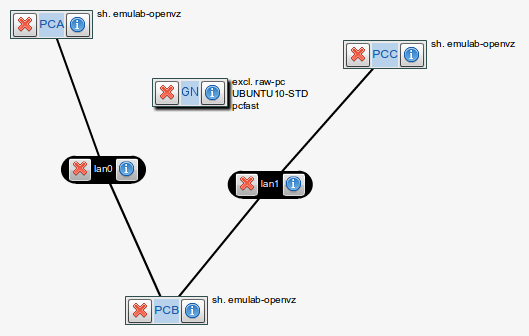
Visually this would look like

NOTE: GEMINI is currently supported only on OpenVZ containers also called Virtual nodes with the Fedora 15 64-bit disk image loaded on the MP Nodes and Ubuntu10-STD image on the Global Node.
5. Instrumentize process
Things to verify before instrumenting your slice :
- Know the path to your GENI certificate file
- Know the passphrase for your GENI certificate file. GEMINI currently does not support decrypted/unencrypted GENI certificates. Its easier and less cumbersome if you can store your passphrase in ~/.ssl/password as explained in the User Workspace setup explained earlier.
- The sliver status for your slice is "READY".
- Make sure you can ssh into the nodes in your slice without being prompted for password. This functionality is one of the fundamental and necessary requirements of setting up the GEMINI I&M System on your slice. See instructions for adding your key to the ssh-agent.
- Renew your slice and slivers. Some certificates used in GEMINI are tied to your slice's expiration date and would need to be manually updated if your slice is renewed after the instrumentize process.
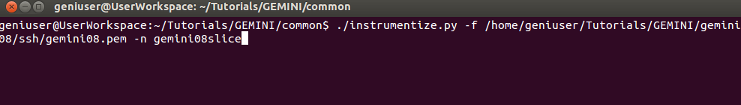
In order to instrument your slice using GEMINI we use the script called "instrumentize.py" with the below mentioned parameters
instrumentize.py -f <PATH TO YOUR GENI CREDENTIAL FILE> -n <SLICENAME>
For example, in your User Workspace VM that your are using in this tutorial, do
geniuser@UserWorkspace:~$ cd ~/Tutorials/GEMINI/commmon/
geniuser@UserWorkspace:~/Tutorials/GEMINI/commmon$./instrumentize.py -f /path/to/your/geni/credential/file -n some_slice_name
If you are experiencing problems , it is helpful to run the above command with a debug option enabled (- d) like below
geniuser@UserWorkspace:~/Tutorials/GEMINI/commmon$./instrumentize.py -d -f /path/to/your/geni/credential/file -n some_slice_name
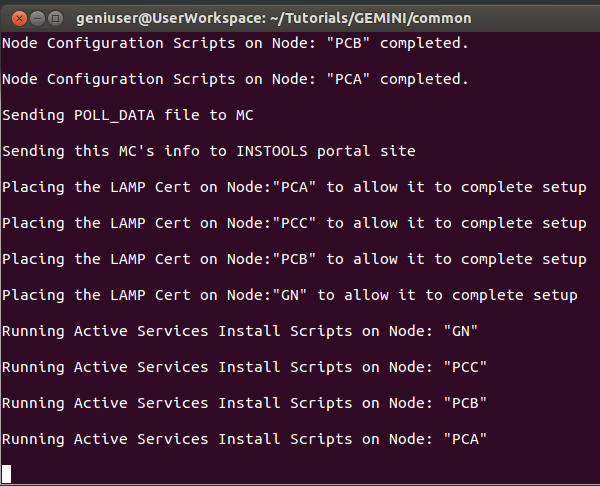
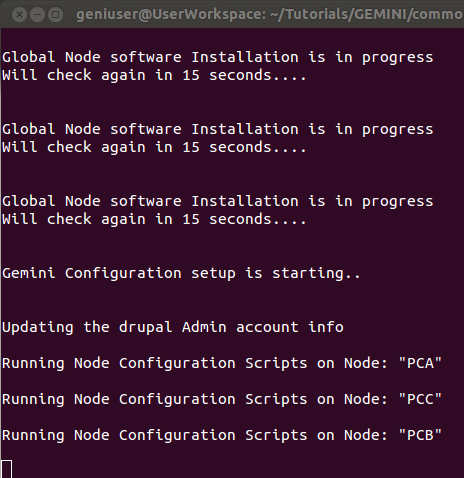
While the instrumentize process is running you will see messages printed out on your terminal informing the action being performed at each stage of the process. In short, the list of steps being performed are
- Check all Nodes to be intrumentized for OS compatibility with the GEMINI Software
- Send your manifest to the UNIS Server (UNIS is mentioned in the GEMINI Documentation)
- Obtain Credential to view Active measurements
- Install all software required for the Passive measurements on the Global Node and Measurement points
- Install all software required for the Active measurements on the Global Node and Measurement points
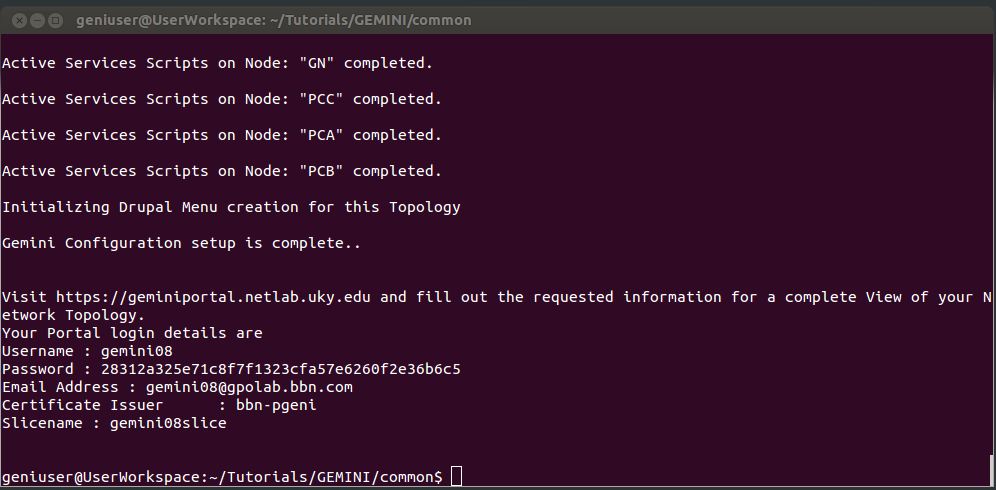
- Send slice information to the GEMINI Portal
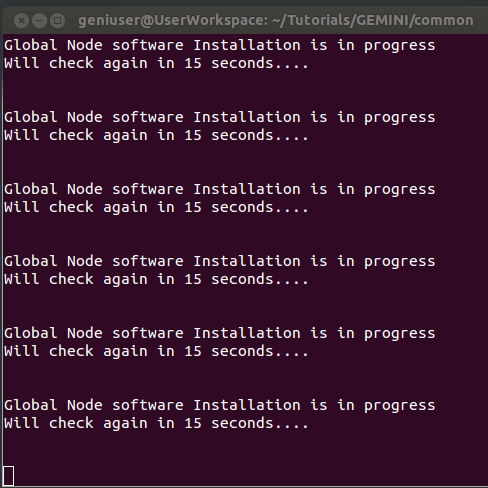
Steps 4 and 5 do take considerable amount of time to complete, hence please be patient. ( currently around 20 minutes on VMs and 10 minutes when using raw nodes )
On successful completion of the instrumentation process you will be given a username,password, link to the geminiportal website, and other information that you may need to login to the geminiportal site (https://geminiportal.netlab.uky.edu/). Please note this information down for use later. Below are screenshots of a GEMINI Instrumentation process and the execution flow of what you would see during this process.


6. Access the Portal
In order to access the GEMINI portal (https://geminiportal.netlab.uky.edu/) use the login information that was given to you after the completion of the GEMINI Instrumentation process. Go to the GEMINI Portal website at https://geminiportal.netlab.uky.edu/

7. Passive Measurements
The set of passive measurements being collected include
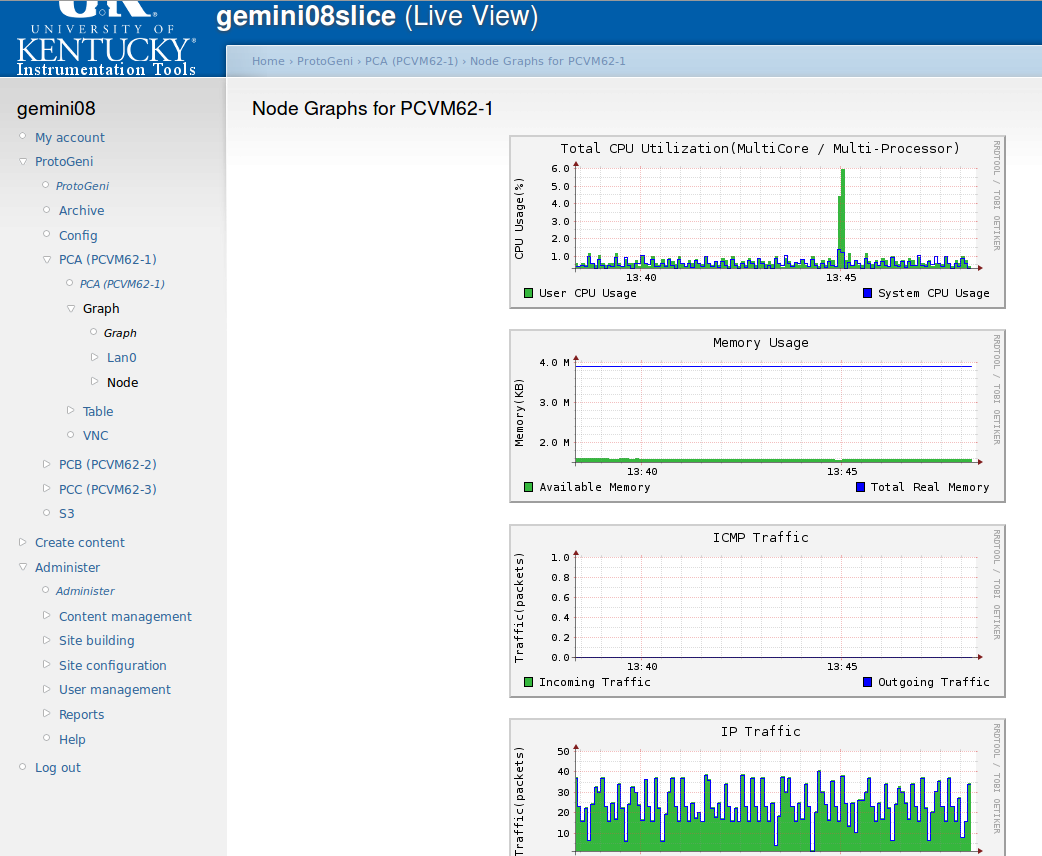
7.1 Graphs
For each Node
- CPU Utilization
- Memory Utilization
- UDP Traffic
- TCP Traffic
- ICMP Traffic
- IP Traffic
- Total Traffic
For each Link Interface
- Link packets count
- Link Octet count
7.2 Tables
- Routing Table
- ARP Table
- Interface Address Table
- TCP Connections Table
- UDP Listeners Table
- Kernel Modules Table
These tables and graphs are collected live and refreshed every 5 seconds and can be accessed using the geminiportal site as shown in the screenshots below.


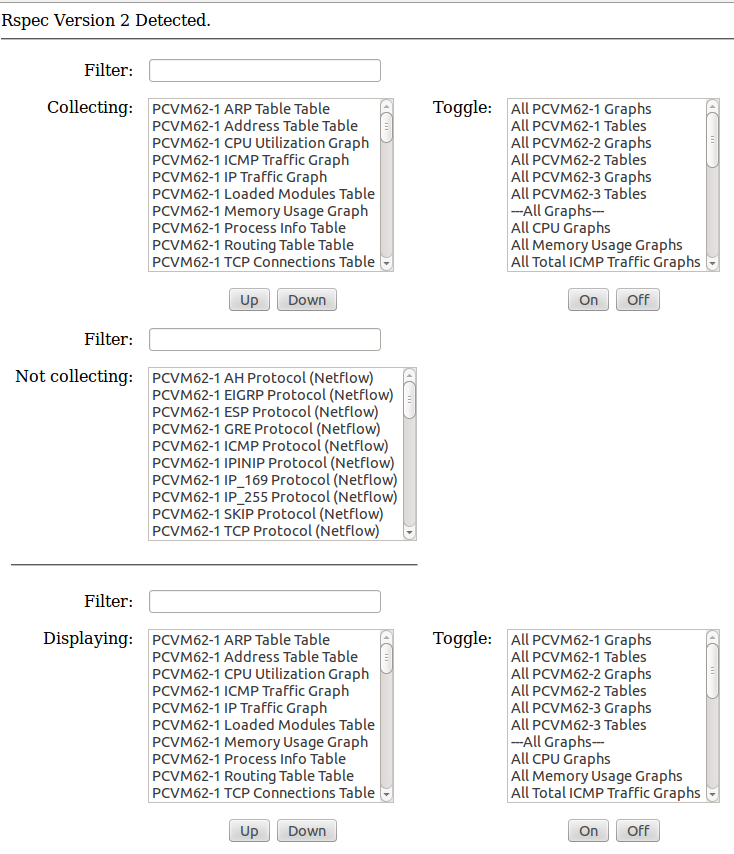
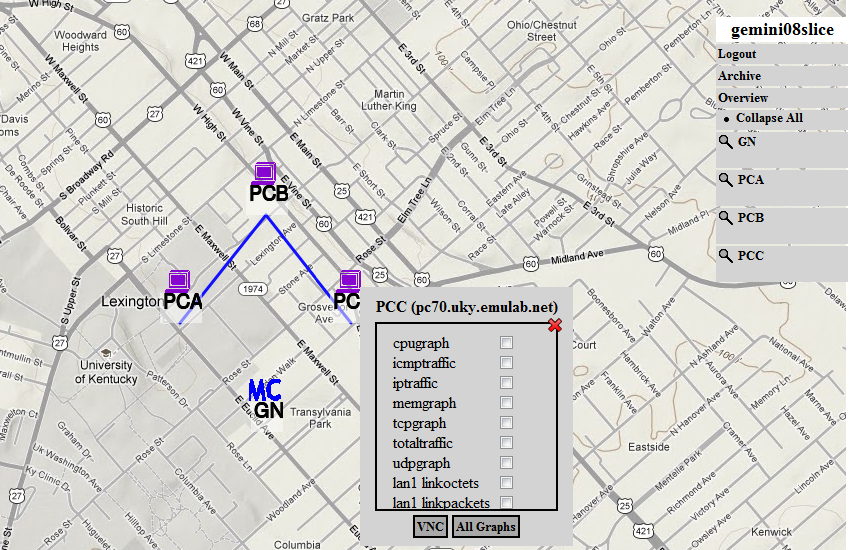
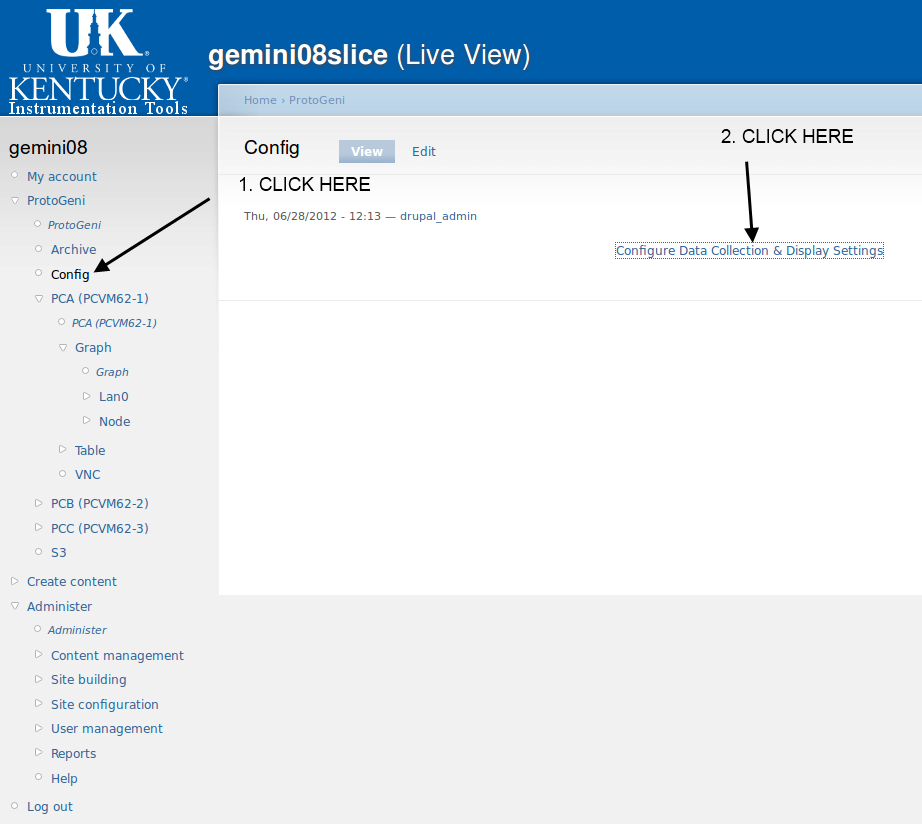
7.3 Reconfigure Passive Data Collection and Display
The data collection and display of these graphs and tables can be reconfigured as per your requirement by accessing the config page from the Global Node which is linked from the GEMINIportal.


As shown in the screenshots above, select/deselect the options according to your requirement and click Apply Configuration at the bottom of the page. Please wait for the reconfiguration to complete and the page stops loading.
Then Refresh/Reload the Main Graph display page in your browser to view the changes.
8. Active Measurements
The GEMINI I&M system in its current version facilitates regular measurements of throughput, one-way delay and round-trip delay. Other metrics like jitter and loss can also be derived from these measurements.
The GEMINI services on a given node are configured by the pSConfig service. This service reads configuration stored in UNIS as part of the node's topology information and applies it to local configuration files. pSConfig will also start enabled services or stop disabled services that are running.
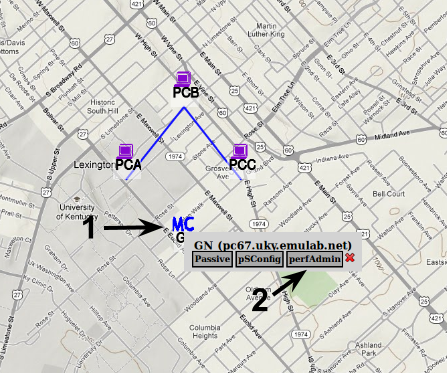
We will now configure one-way (OWAMP) and round-trip (Ping) latency regular tests according to the following diagram.

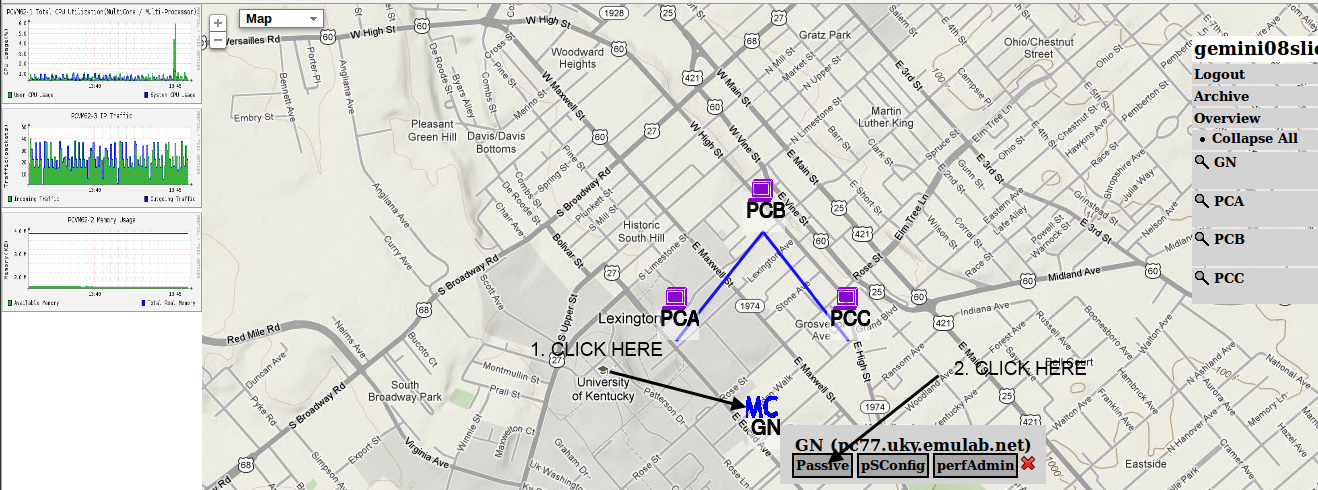
8.1 Accessing pSConfig UI
To configure active measurements we access the pSConfig Web UI. You can find the URL by clicking on the MC node on the GEMINI portal, or by going to https://<gn node>/psconfig.

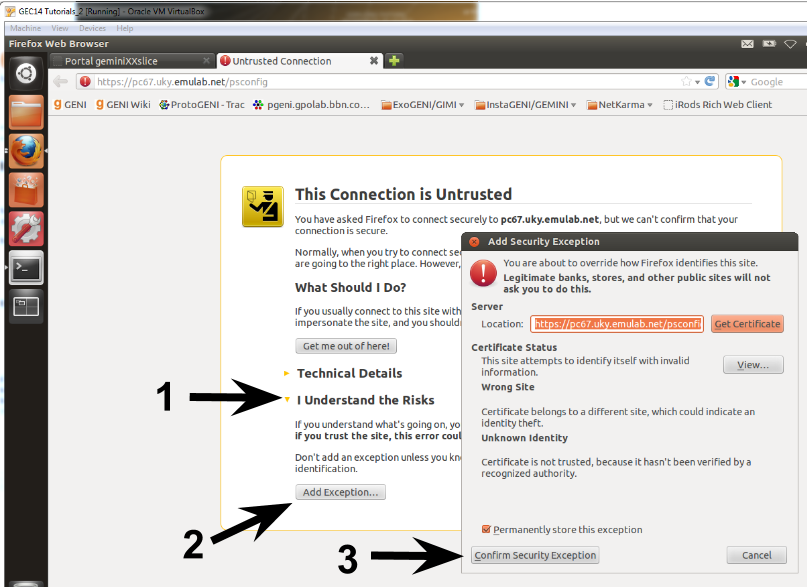
The certificate used by the web server is self-signed, so you will have to add an exception on the browser to proceed.

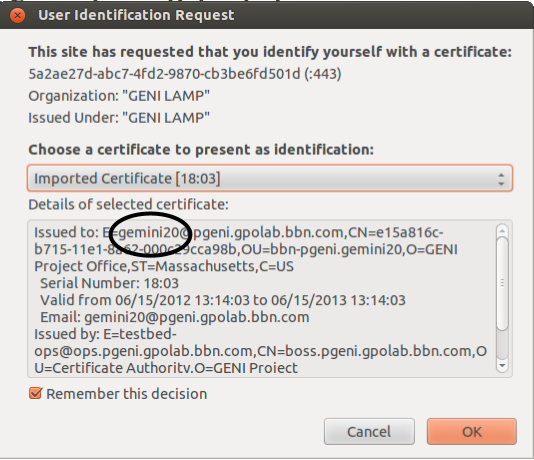
After adding the exception you should see another pop-up for a certificate request. This time you're providing your user certificate to the service. Make sure the user that is shown for the certificate is the one assigned to you for the tutorial. In this example I'm using the user gemini20. In case you did not see this pop-up or cannot see your user, please redo the steps on User Workspace - Accessing the portal.

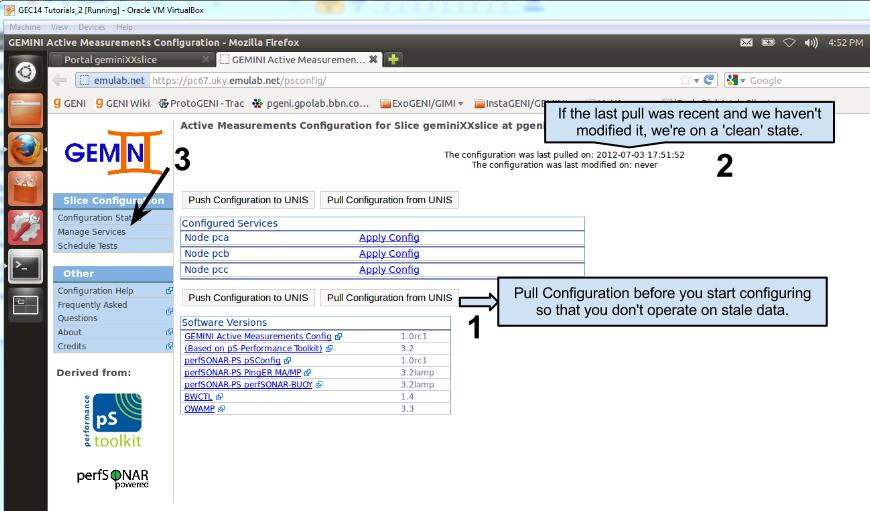
The main page of the pSConfig UI shows what services are currently enabled for each node. It also shows the last time we have synchronized with UNIS (remember that configuration information resides in UNIS). There are other agents that could be changing the information on UNIS, and the pSConfig UI will make sure we don't overwrite changes made since the last pull (i.e. a race condition). It is always a good idea to first pull the current configuration from UNIS before making changes.

8.2 Enabling Services
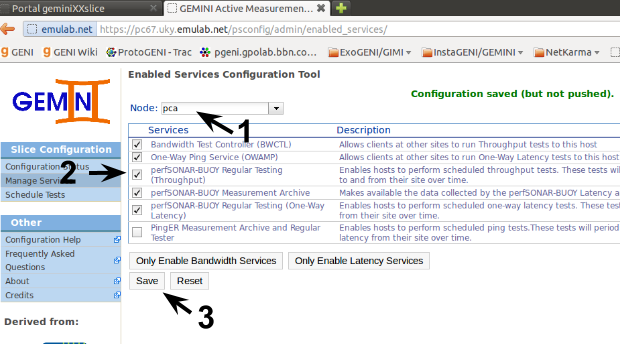
After we've made sure to have a recent copy of the topology information, we can move on to the Manage Services administration page. On this page we will enable the services required to perform on-demand and regularly scheduled tests. We start by enabling the throughput and one-way latency services on PCA. Make sure to save the changes before continuing to the next node.

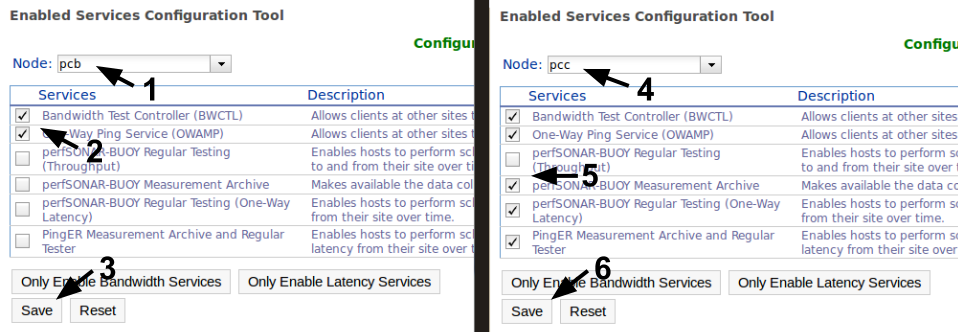
We then proceed to configure the services on nodes PCB and PCC. Since PCB will be the gateway, we will only enable the daemons for the tools used (owamp and bwctl). PCC will have all the latency services and the daemon for throughput measurements. Note that PingER is only enabled on PCC, and we will configure our Ping measurement on that node. (We will use PCA for the scheduled throughput measurements at the end of the tutorial.)

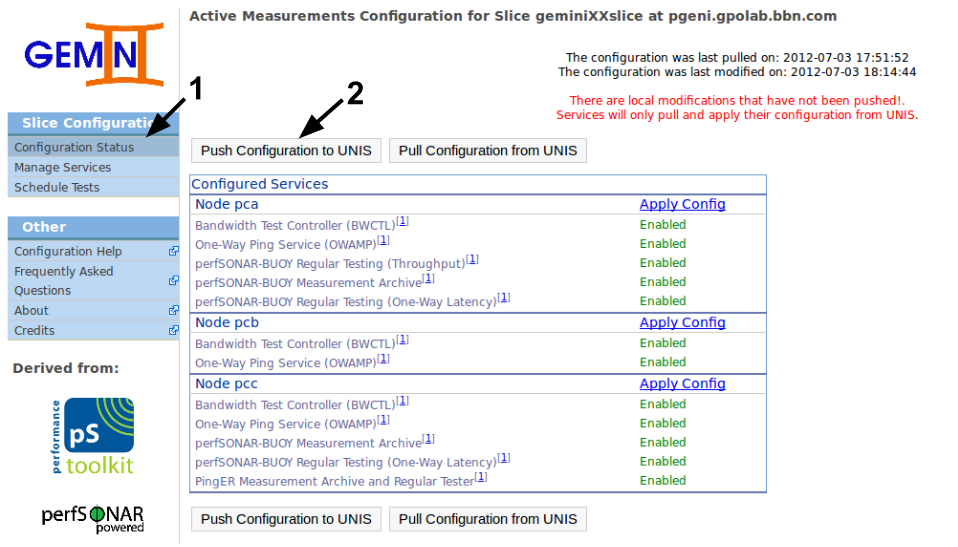
Now that we've enabled the services for our active measurements we will push the configuration to UNIS. To do this we need to go back to the Configuration Status page and then click the Push Configuration to UNIS. You can verify the list of services enabled for each node (i.e. the list in the image should match what you see).

If everything goes well we should see a green message "Configuration pushed to UNIS.". However, the page auto reloads after this, so you might miss it if not paying attention. If there is no error message, the push completed successfully and the modification time will be 'never'.
Success:

Failure (unfortunately, you will have to redo the steps above in the case of a race condition):

8.3 Configuring Regular Active Measurements
Enabling the OWAMP and BWCTL daemons is all we need to perform on-demand active measurements. However, it's usually better to have active measurements running regularly to analyze the performance over time. Throughput and ping tests can be scheduled with a given interval (e.g. every 30 minutes). One-way delay tests are scheduled as a stream (a constant amount of packets is sent per second).
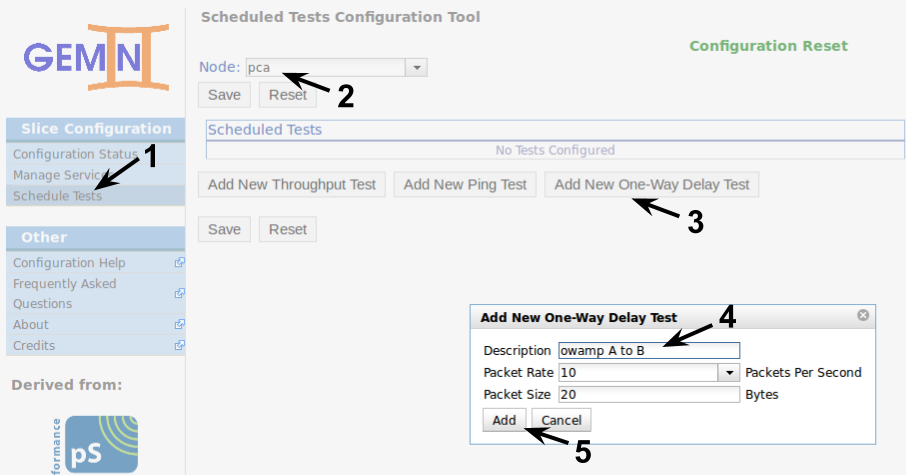
To schedule regular tests we go to the Schedule Tests administration page.

We will schedule OWAMP tests from PCA to PCB. We could schedule them on either endpoint, as long as both of them are running the appropriate pSBOUY Regular Testing service. In this case we schedule the tests on PCA by selecting it and adding a new OWAMP test. Clicking the Add New One-Way Delay Test button will pop-up the options to configure the test. The description for the test is only important to you, the services don't use it directly. You can change the packet rate and the packet size used for the test, but we will use the default for the tutorial.

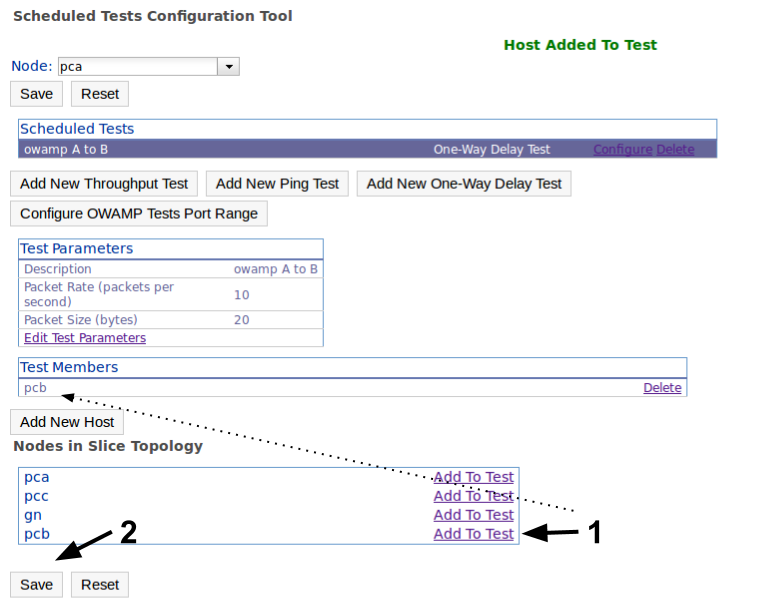
The test we've added establishes the test parameters for a given "star" mesh configuration. We can add multiple targets for this mesh (for OWAMP tests will run in parallel, for BWCTL measurements will be serialized). In this case we add PCB as a target and save the test.

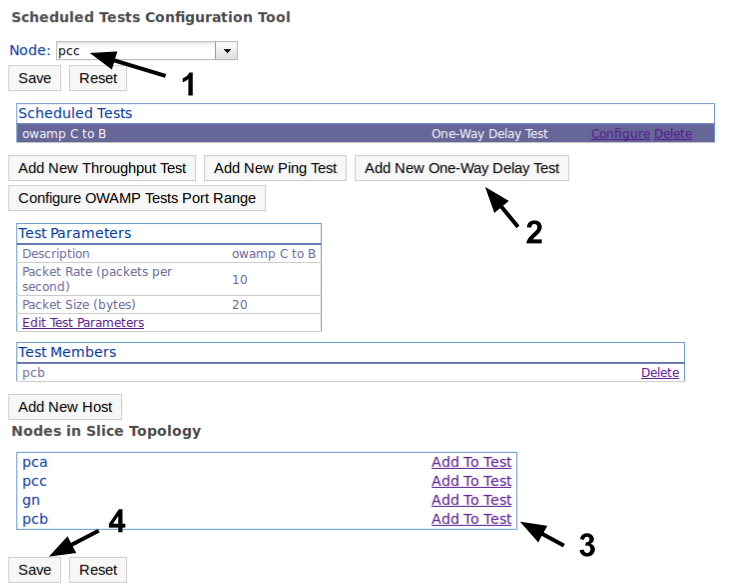
Now we do the same thing on node PCC (one-way delay test to PCB).

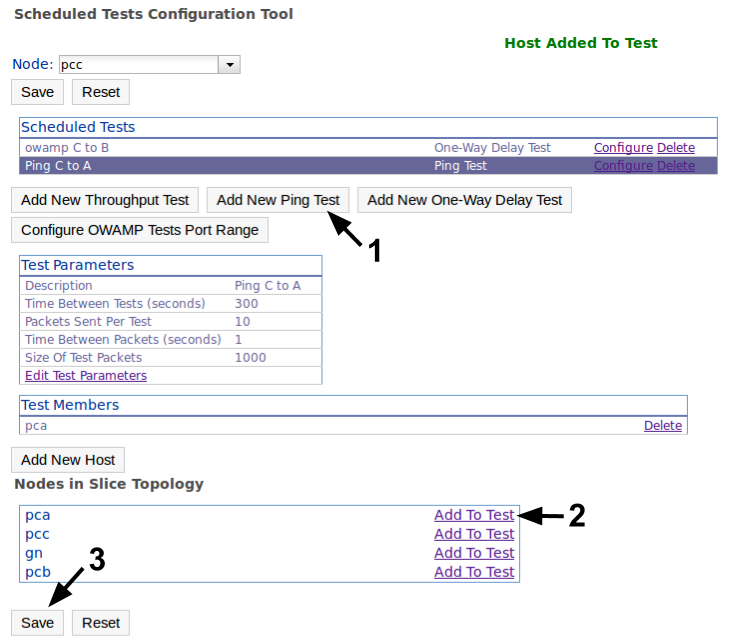
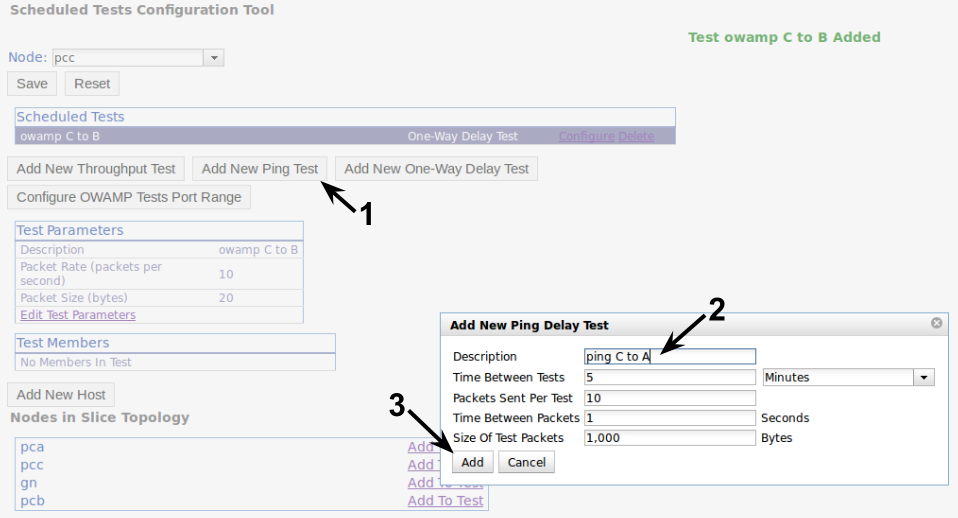
We also add a Ping test between nodes PCA and PCC, scheduled at node PCC (this is where we enabled the PingER service).

We can configure the standard ping parameters and the description for our test. The default has a relatively large packet size, so keep this in mind when analyzing the latency results (the ideal is to have packets the size of your experiment's packets). After creating the test we need to add our targets (PCA) and save the test. NOTE: You could use the 'Add New Host' button to add hosts outside of the slice (e.g. to ping geni.net).

After adding all these tests we go back to the Configuration Status page and push the configuration to UNIS.

8.4 Applying the Configuration
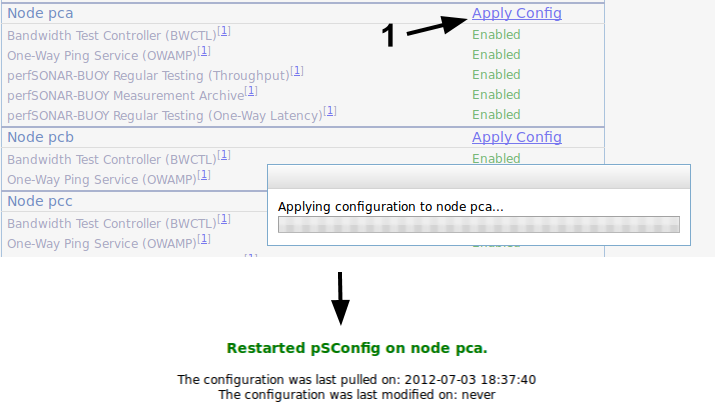
pSConfig will pull the node's configuration from UNIS every 30 minutes (from the time it was started, not hh:00 and hh:30). Since we don't want to wait this long to start gathering data, we can restart pSConfig on each node by clicking the Apply Config link. This is achieved by ssh'ing to the node and restarting pSConfig, so errors are usually ssh related.

Make sure you apply the configuration on all three nodes. We will now run the user experiment to generate some heavier traffic on the slice before looking at the data.
9. User Experiment
The purpose of this experiment is to run transfer tests between two nodes within your experiment topology and observe performance using the I&M tools within GEMINI. You will also investigate using XSP to perform transfer tests over Phoebus running on a “gateway” node in the center of your topology. This experiment should generate enough traffic to get some interesting graphs. We won't go into details of Phoebus/XSP, you can find more information at https://damsl.cs.indiana.edu/projects/phoebus. For the purposes of this tutorial, doing some iperf transfers should be sufficient to go to the next sections.
PCA ↔ PCB (Phoebus Gateway) ↔ PCC
To perform a throughput measurement using iperf we must first start a server to listen on one endpoint. We will use PCC as the iperf server. You can access PCC either through ssh (see your info sheet for the address/port) or using the VNC option on the GEMINI portal.
On PCC, run the following shell command:
[gemini20@PCC ~]$ iperf -s
------------------------------------------------------------
Server listening on TCP port 5001
TCP window size: 85.3 KByte (default)
------------------------------------------------------------
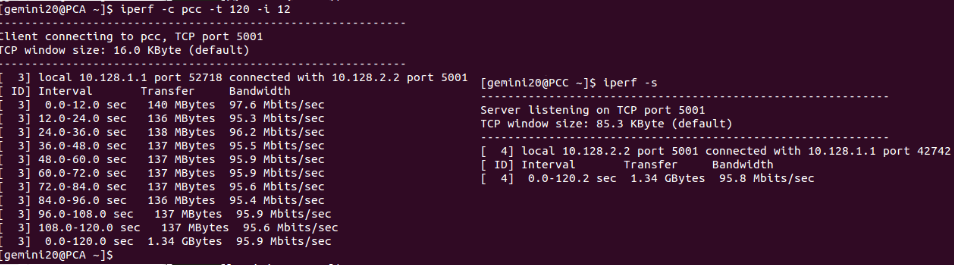
We also connect to PCA and now use iperf as the client to start the transfer. You can run iperf -h to learn more about the options we are using.
[gemini20@PCA ~]$ iperf -c pcc -t 120 -i 12
If everything went well you should see results similar to the following.

9.1 Using Phoebus and XSP
Now we will setup PCB as a Phoebus Gateway (PG) and use XSP on the client node (PCA). We will also introduce some network impairments in our experimental topology to highlight how the PG can improve performance in challenged network environments. We will then perform the same iperf test and check differences in the performance.
On node PCB, run:
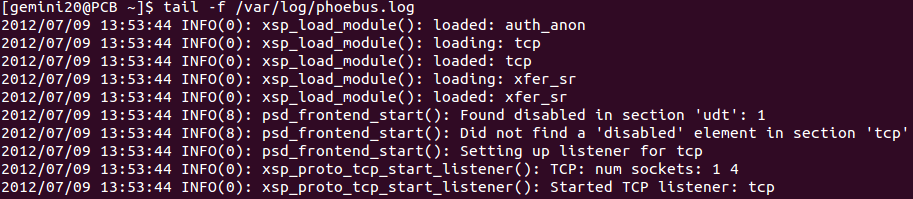
[gemini20@PCB ~]$ sudo /etc/init.d/phoebus start
[gemini20@PCB ~]$ tail -f /var/log/phoebus.log
The output should look similar to this:

This will start the Phoebus service and allow you to view the log as Phoebus accepts connections and forwards network traffic.
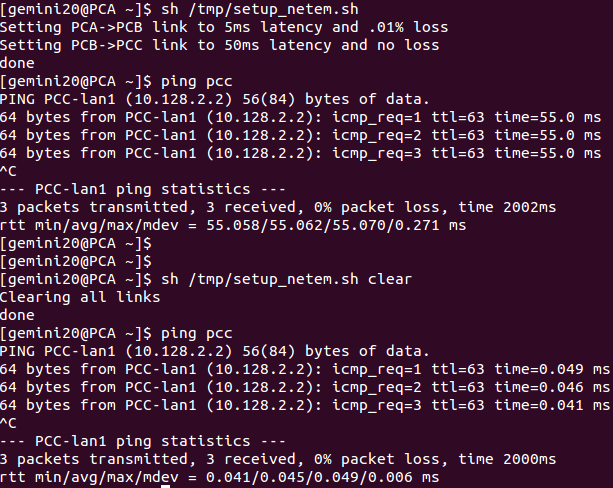
Now we will introduce some network impairments. These consist of a certain amount of loss (.01% uniform packet loss) and minimal delay (5ms) on the PCA<->PCB link. Additionally, more significant delay (50ms) will be added on the PCB<->PCC link. On PCA, run:
[gemini20@PCA ~]$ sh /tmp/setup_netem.sh
Ping pcc and you will notice increased delay.
To remove the network impairments, run:
[gemini20@PCA ~]$ sh /tmp/setup_netem.sh clear
The delay and loss will be removed. You should see output similar to this:

For the following tests, please keep the network impairments enabled.
NOTE: This setup_netem.sh script is customized for this tutorial. If you would like to repeat these experiments with your own GENI credentials, please use the setup_netem_user.sh script, also available in /tmp/ on PCA. This script assumes you forward your GENI ssh key (-A flag to ssh). The script may also be further customized based on your personal ssh preferences.
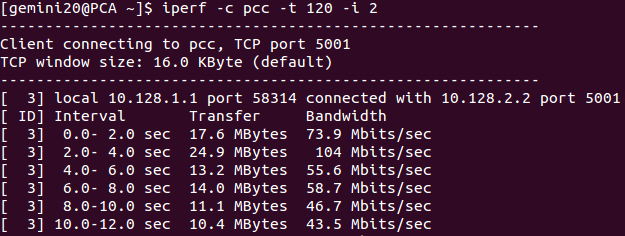
With the delay and loss applied to the links, run an iperf test to get a new baseline of performance:
[gemini20@PCA ~]$ iperf -c pcc -t 120 -i 12

We notice that the network impairments are having a significant impact on the transfer rate. We will now setup your shell environment to allow iperf tests to work with the Phoebus service and hopefully improve the transfer performance over the same network conditions.
If you are running csh: (run 'echo $0' to determine your shell)
[gemini20@PCA ~]$ setenv LD_PRELOAD /usr/lib64/libxsp_phoebuswrapper.so
[gemini20@PCA ~]$ setenv XSP_PATH pcb/5006
If you are running bash:
[gemini20@PCA ~]$ export LD_PRELOAD=/usr/lib64/libxsp_phoebuswrapper.so
[gemini20@PCA ~]$ export XSP_PATH=pcb/5006
These commands enable library interposition for sockets application, allowing standard TCP client connections to be intercepted by the PG running on PCB. Now we can run the iperf tests once more:

Observing the Phoebus log output on PCB, you should see activity that indicates an incoming connection and the startup of forwarding threads. The iperf transfer is now being forwarded over the Phoebus service on PCB.

The observable performance of iperf should be much improved as the connections are accelerated by the Phoebus service. The data collected by GEMINI should now reflect the iperf transfers that were just run. One you are satisfied that you have run enough iperf tests, you may Ctrl-C the Phoebus log on PCB and log off the terminals. After this point, both the Phoebus service and iperf server instance may also be shut down.
[gemini20@PCB ~]$ sudo /etc/init.d/phoebus stop
On PCC, Ctrl-C the iperf server before logging off.
10. Visualize Measurement Data
Doing the user experiment should have given the scheduled active measurements enough time to gather some data. We also generated some heavy traffic during our iperf data transfers. This section of the tutorial covers how to visualize the data for regular active tests. We will also check the passive monitoring graphs again to see how the iperf transfers affected our hosts.
10.1 Accessing perfAdmin for Active Measurements Data
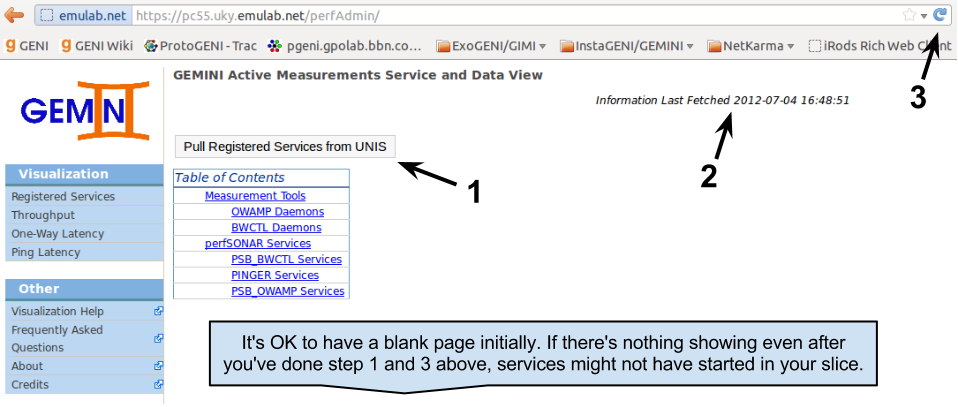
To query and visualize the active measurements data we will use perfAdmin. perfAdmin is a web service that is able to query perfSONAR services and plot relevant data. You can access a perfAdmin instance running on your slice through the portal or by going to https://<gn node>/perfAdmin (note the capitalization).

There are two sides to perfAdmin. The first side of perfAdmin is showing which services have registered to UNIS and are thus "known". The other side is querying a perfSONAR service (or set of services) for measurement data and displaying it to users.
The landing page will show which services we know about from the information on UNIS. If this is your first time opening this page, you will probably be greeted with a blank page. The services should have had enough time to start and register themselves with UNIS. We pull the information from UNIS (make sure the last fetched date changes) and then refresh the page to make sure we have the latest information.

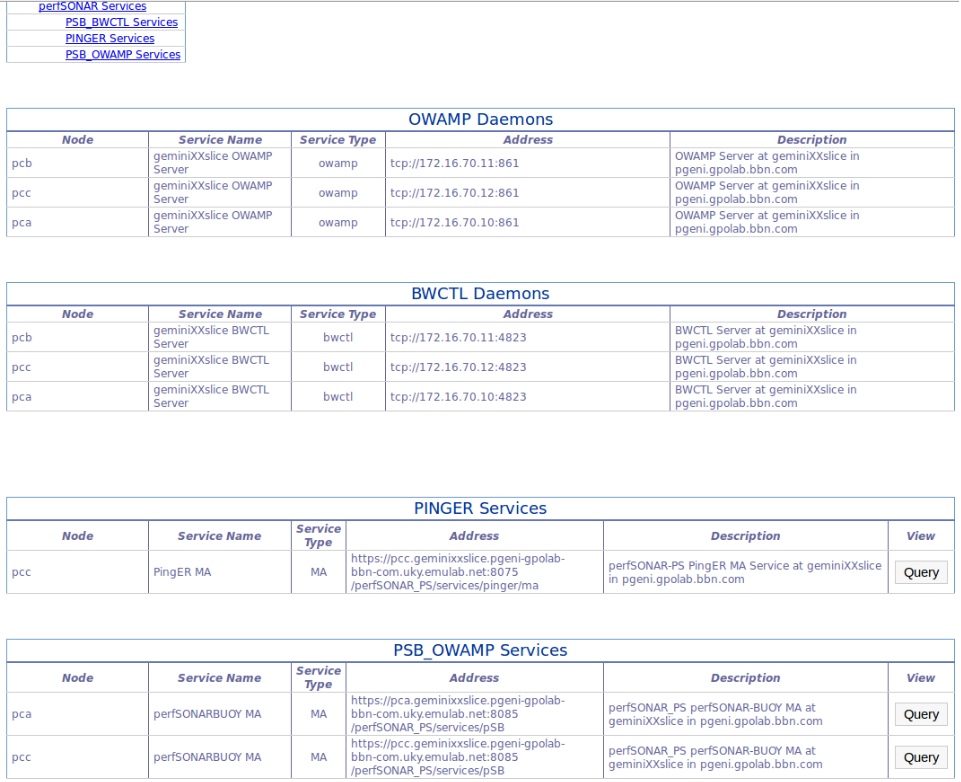
After doing this we should see all the services we enabled during the configuration section for active services. NOTE: There are many reason why services might not show: pSConfig on the node hasn't pulled the configuration from UNIS yet (see Apply Config above); the services didn't have any data to register with UNIS (services usually register every 30 minutes or when changes are detected); or there might be a problem talking to UNIS. Please contact us if you're having trouble.

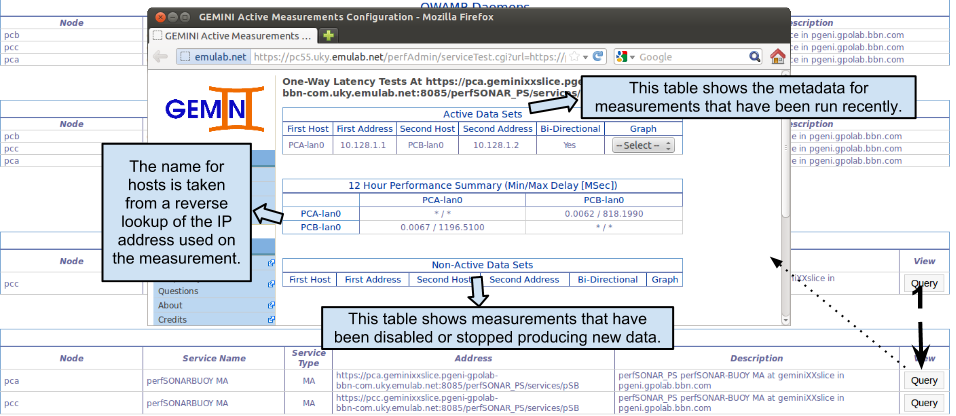
On the list of services we can see the tool daemons for OWAMP and BWCTL. We can also see the perfSONAR services storing the Ping and OWAMP data from the tests we've configured. From this page we can query a given service to see the corresponding data. The active measurement data is stored on the node that initiates the measurements and is served by a perfSONAR service running on that node. For example, we can query the perfSONAR BUOY OWAMP MA on node PCA to see the OWAMP data from PCA to PCB.
NOTE: When querying a single service, perfAdmin will first fetch all the metadata stored on that service. After obtaining the metadata, perfAdmin queries the service for data in order to build summaries and distinguish between active and inactive data sets. This process may take some time if there are many measurements stored on a given service.

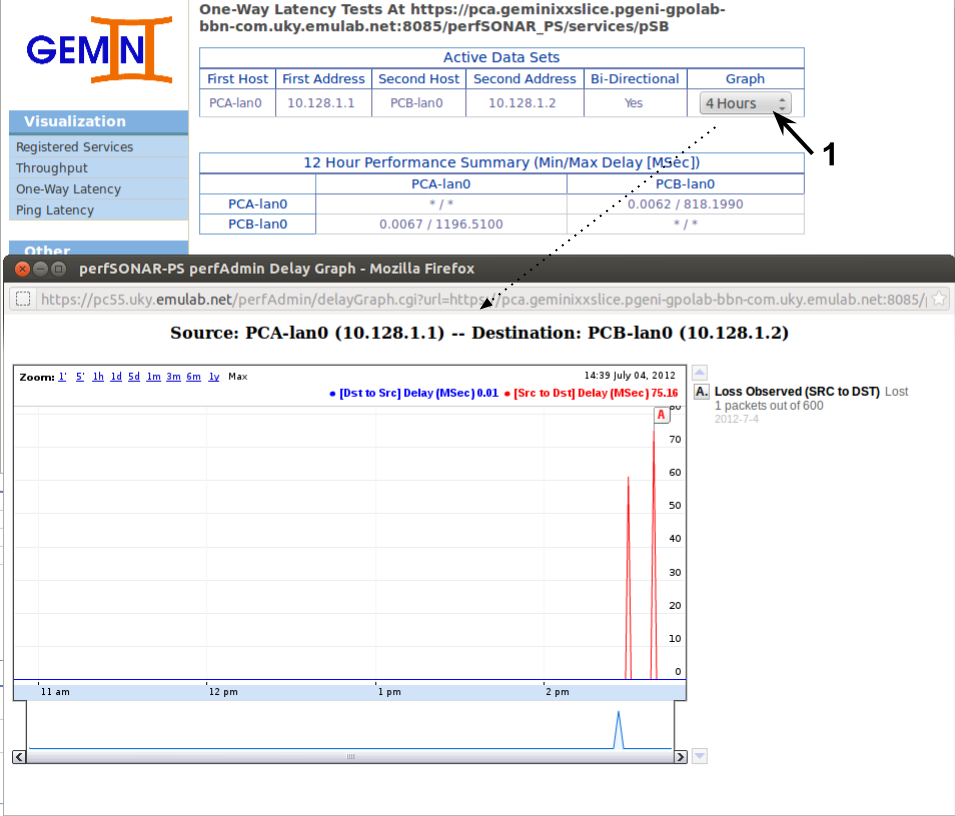
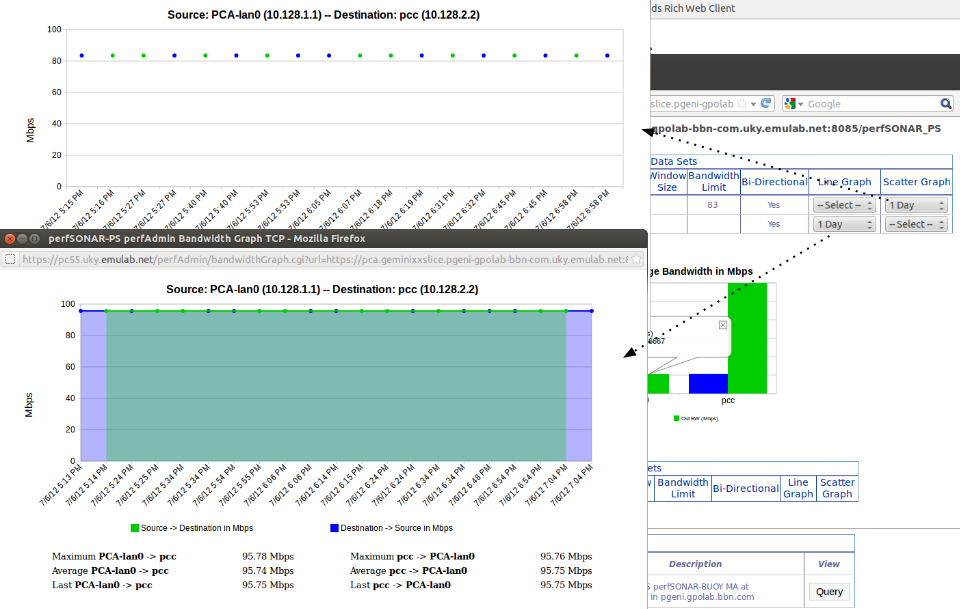
In this particular case we only have one OWAMP measurement stored at this service. We can graph by selecting a time range from the select box. perfAdmin will query the service for all data points within the last X hours and plot those (data points might be aggregated depending on granularity). The graphs are a little bit interactive, e.g. you can mouse over different data points and see the values for each direction.

The graph above shows two spikes measured latency and a lost packet during one of those. These spikes correspond to the iperf data transfers where we were saturating the links.
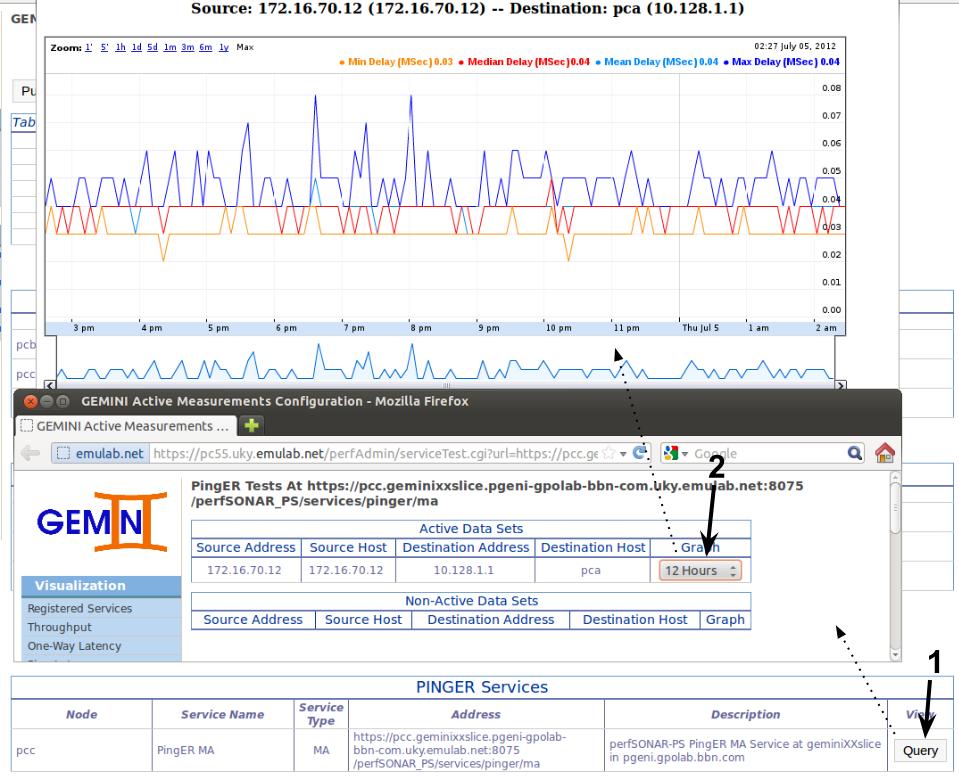
We can access the Ping data from our scheduled test in a similar way. Going back to our Registered Services page, this time we access the PingER service on node PCC.

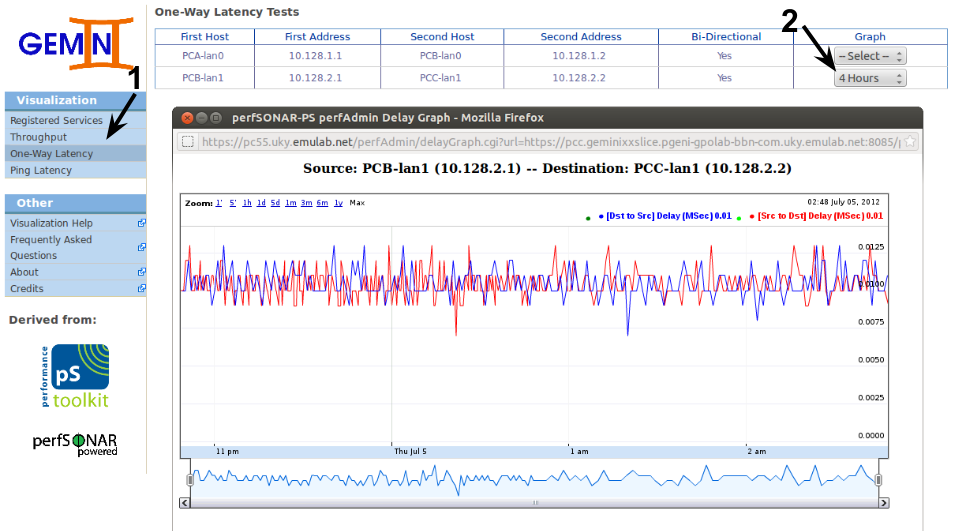
While it's good to be able to query each service for its data, sometimes it's better to have access to all measurements in our slice on the same page. perfAdmin provides this option on the left menu for each of the regular testing measurement types currently supported (One-way Delay, Ping and Throughput). When we access one of these pages, perfAdmin will query each known service storing measurements of the given type for all the related metadata. It then builds a single page that we can use to query for a particular measurement's data. For example, if we go to the One-Way Delay page we should be able to see the measurements stored in both nodes PCA and PCC.

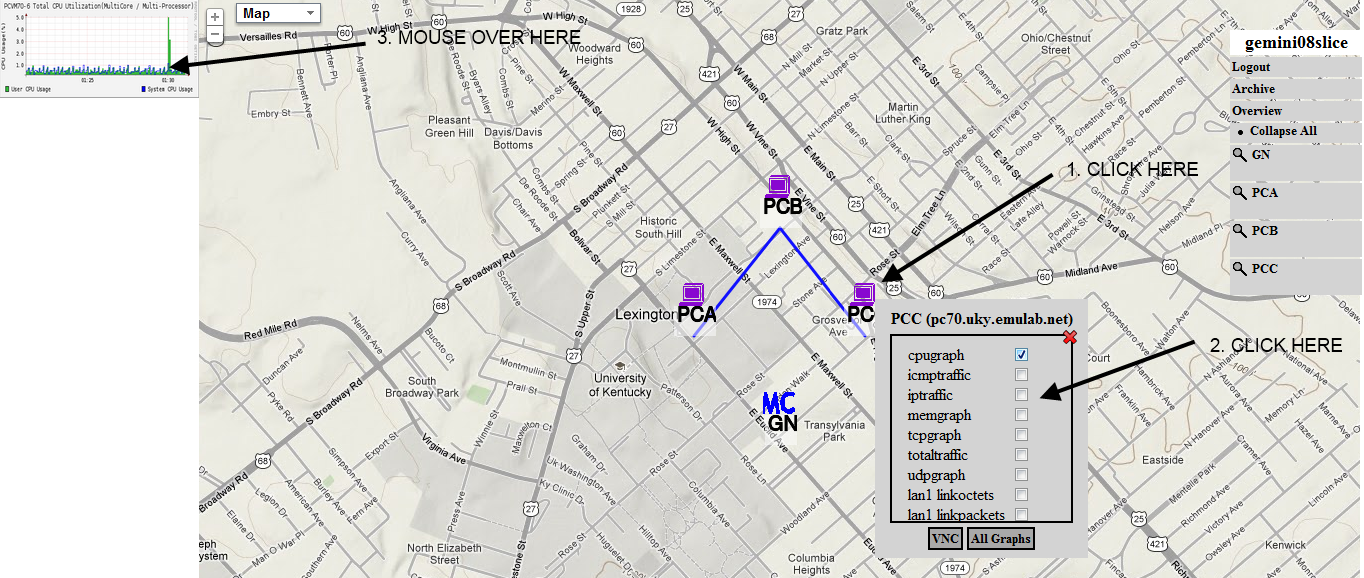
10.2 Changes in Passive Monitoring Graphs
Using the GEMINI Portal, you can also view the changes in Passively monitored Network traffic and system resources when running any experiment or traffic or any other kind of load on the nodes in your slice.
11. Archive Measurement Data
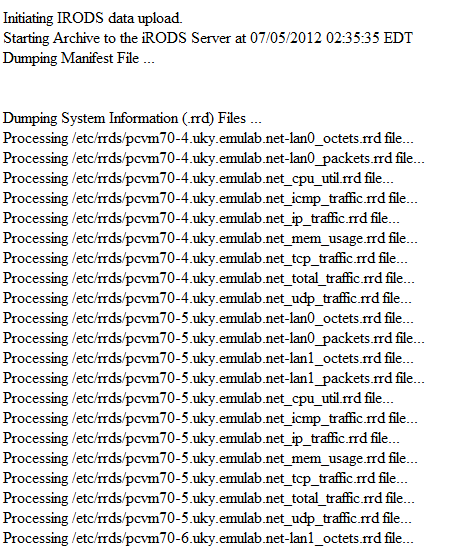
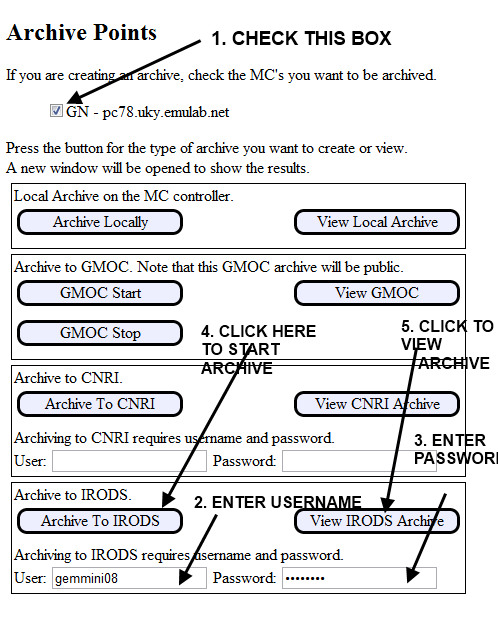
The current version of the GEMINI I&M System can archive all the passive measurement data collected to a wide variety of archive services. We plan to use the iRODS archival service as the default archive service for all data being collected in the near future. In order to archive the data to the GEMINI-iRODS archive , you will need to request for a separate account (username/password) from the GEMINI Team to use the archive service. Once you have the account details, you can provide those to the archive form as shown below
NOTE: Make sure to check the box for the hostname of the Global Node whose data is to be archived. It does take a couple of minutes to see debug output on the new tab opened in your browser when you click on the "Archive" Button. Please wait until the page has completed loaded.( You may see a blank page until then.)


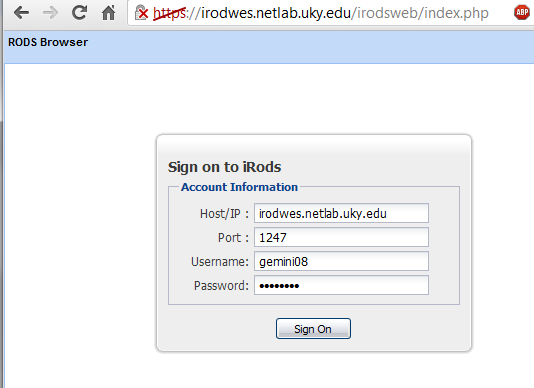
To view the archive Click on "View Archive" and fill in the details requested on the form presented to you
Some login credentials you may need here are
Host / IP : irodwes.netlab.uky.edu
Port : 1247
Username : <Provided to you by the GEMINI Team>
Password : <Provided to you by the GEMINI Team>
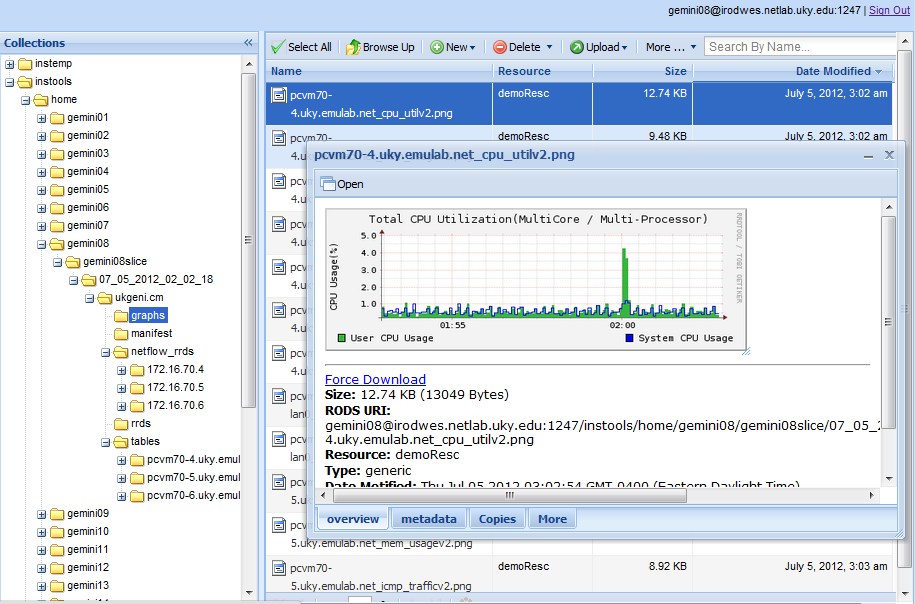
If you would like to visit the iRODS Archive website to view your archives at a later date , you could also go directly to the GEMINI Archive:https://irodwes.netlab.uky.edu/irodsweb/


Each archive point is stored in a folder type data heirarchy structure , orgranized by Slicename --> date-time --> Aggregare HRN --> Data as shown in the screenshot above.
12. Digging Deeper
12.1 On-demand Active Measurements
Having OWAMP and BWCTL enabled on the nodes lets us perform measurements at any time. We used iperf in the user experiment to emulate data transfers, but iperf was really measuring the achievable bandwidth between the nodes. In fact, iperf is the tool we use to measure throughput in GEMINI.
As you may recall, iperf required a server to be started on one endpoint. BWCTL works as a wrapper for iperf (and similar tools) providing authentication mechanisms, coordination (i.e. serialization of tests) and third-party control. You can learn more about BWCTL at this official site. Since we have already enabled BWCTL on all endpoints, we don't need to start an iperf server, the BWCTL daemon can do that for us.
To perform a throughput measurement from PCA to PCC, we could have used bwctl:

We could also perform a measurement from PCB to PCC while being on node PCA by setting both receive and send endpoints:
[gemini20@PCA ~]$ bwctl -s pcb -c pcc
All bwctl needs to start the measurement is to reach the bwctl daemons running on each of the endpoints. OWAMP works similarly, but doesn't provide the ability to do third-party measurements and doesn't serialize tests.
To perform your own one-way delay measurements on-demand, use the owping tool from one of the endpoints. NOTE: The owamp daemon must be running on the other endpoint.

By default the tool will perform the one-way delay measurement for each direction. See the official page of OWAMP for more information on its capabilities.
12.2 Scheduling (Active) Throughput Measurements
GEMINI also provides a way to schedule regular throughput measurements. Scheduling this type of test is very similar to scheduling One-Way Delay and Ping tests. We schedule active tests by accessing the pSConfig web UI (see 8.1 Accessing pSConfig UI). NOTE: We recommend doing a Pull Configuration before starting this section to avoid race conditions.
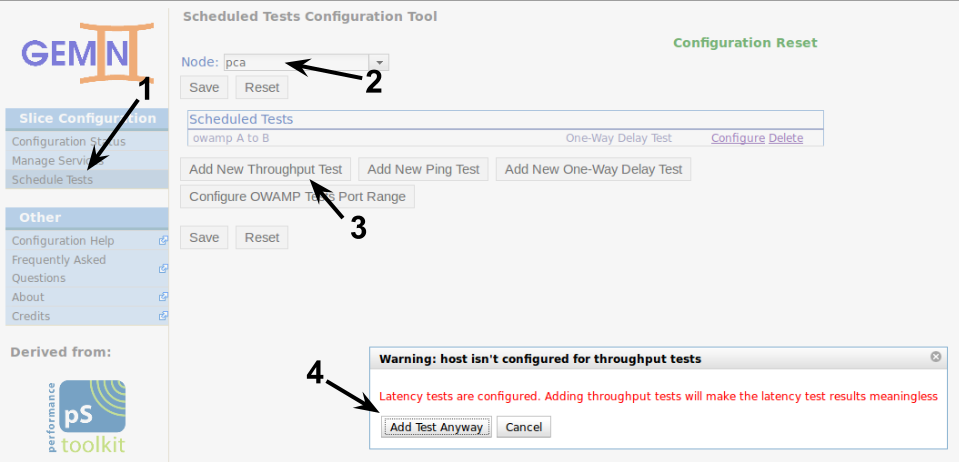
Access the Schedule Tests page, select the node that will perform the measurements (PCA) and then click the Add New Throughput Test button. NOTE: We have already enabled the necessary service for regular throughput testing when doing section 8.2 Enabling Services.

In this case we got a warning for configuring throughput tests on the same node that is running latency tests. Latency and jitter are very sensitive to host load, even more so when measured one-way or at fine granularity. Ideally we would use separate nodes for throughput and latency, but here we will add the test anyway to the same node. NOTE: By separate nodes we mean that each node does not participate in the other type of test in any role.
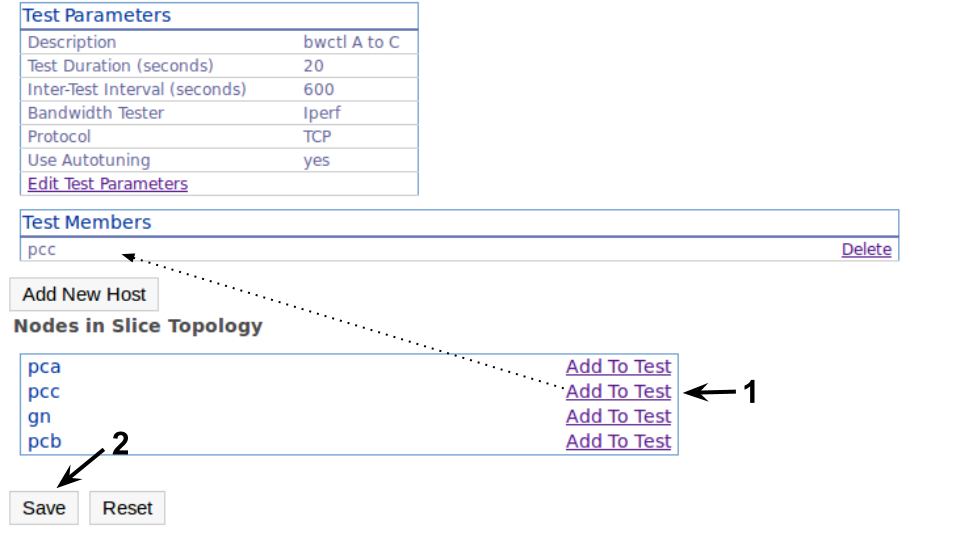
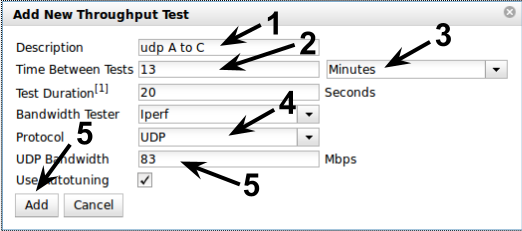
For throughput tests we have to be extra careful of the periodicity and the load we're injecting into the network. In this case we're adding a TCP measurement lasting 20 seconds and performed every 10 minutes. This is just so we have multiple data points to show in a short time, but you would normally not want tests this frequent. NOTE: You can set this to 3-5 minutes if you're running out of time during the tutorial but would still like to see some results.

We proceed by adding the other endpoint, PCC, to the test mesh and saving the configuration.

We can also add a UDP throughput test. When configuring UDP tests we need to set a maximum (or desired) data rate for the tool. Since UDP does not have congestion control, setting the data rate too high could overwhelm the path. If the UDP Bandwidth is set to 0, iperf will default to 10 Mbps.

Proceed to add node PCC and save the configuration in the same way we did for our TCP test. Now remember that all configuration we do through the web UI is saved locally, but the nodes (i.e. pSConfig) only access the configuration stored in UNIS. We must now push the configuration to UNIS so the changes take effect.

To speed up the propagation of changes, you can perform the steps in 8.4 Applying the Configuration. We've only changed the tests configured for node PCA, so there is no need to apply the configuration on other nodes.
12.2.1 Visualizing Regular Throughput Measurements
To visualize our scheduled throughput tests we follow similar steps to section 10.1 Accessing perfAdmin for Active Measurements Data. When accessing perfAdmin, the list of services shown will be the data we got from our last pull. The perfSONAR BUOY BWCTL service wasn't there because we didn't have any throughput tests scheduled back then. Now that we do, we need to do a Pull of data from UNIS to update the list. NOTE: It may take a while for the service to show (the time it takes to get data from the test and for the service to notice the new data).

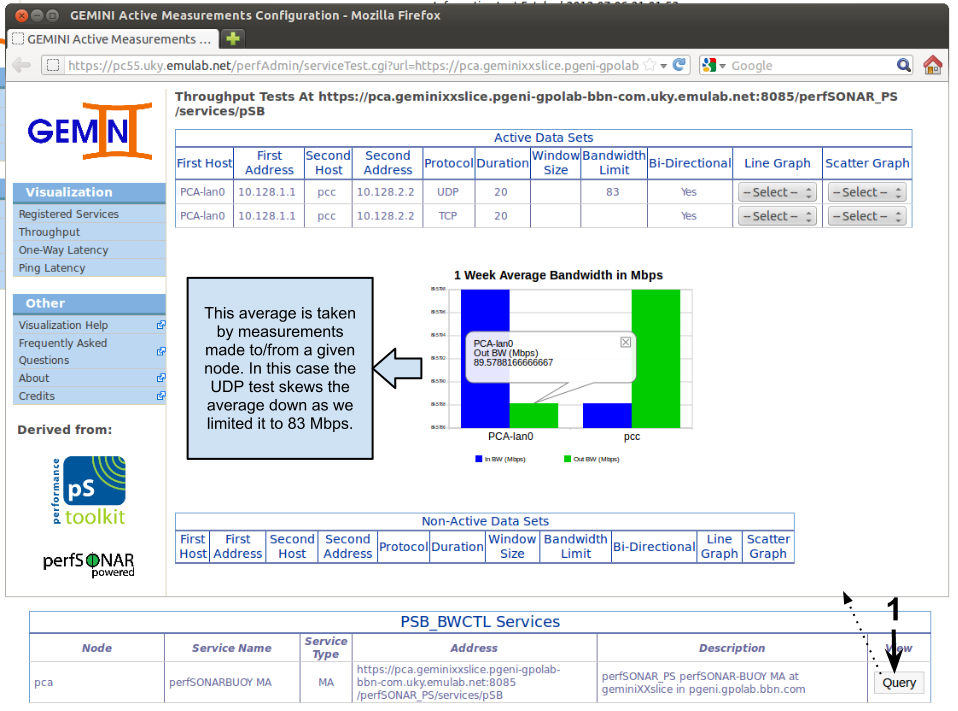
Now that we have the information for the service on perfAdmin, we can Query it for throughput measurements. The perfAdmin interface for a single pSB BWCTL query is very similar to the pSB OWAMP one. We have the active data sets for which recent data is available, a 1 week average of bandwidth in both directions for each node, and inactive data sets.

Differently from the OWAMP interface, we can plot the throughput data in either Line Graphs or Scatter Graphs. Both graphs also show the maximum, average and last values for the test.

12.3 Using perfSONAR API to Query UNIS and Services
This section will show how to user the perfSONAR API to query perfSONAR services. One use for this is to query the topology information of our slice from UNIS. The active measurement configuration is stored as topology annotations, so we can easily save the enabled services and scheduled tests configuration for our slice. We could then merge this configuration to a new slice (with same or similar topology) and have our active measurements configured without going through the pSConfig Web UI.
This section is not finished, please check back soon''
Attachments (66)
- latency-tests.png (16.5 KB) - added by 12 years ago.
- psconfig-portal.png (285.2 KB) - added by 12 years ago.
- psconfig-secexception.png (174.5 KB) - added by 12 years ago.
- psconfig-main.png (150.9 KB) - added by 12 years ago.
- psconfig-managepca.png (102.3 KB) - added by 12 years ago.
- psconfig-managepcbpcc.png (172.8 KB) - added by 12 years ago.
- psconfig-managepush.png (189.9 KB) - added by 12 years ago.
- psconfig-managepushsuccess.png (50.5 KB) - added by 12 years ago.
- psconfig-managepushfailure.png (39.3 KB) - added by 12 years ago.
- psconfig-schedule-pcacreate.png (87.1 KB) - added by 12 years ago.
- psconfig-schedule-pcasave.png (89.2 KB) - added by 12 years ago.
- psconfig-schedule-pccowd.png (85.0 KB) - added by 12 years ago.
- psconfig-schedule-pccping.png (97.3 KB) - added by 12 years ago.
- psconfig-schedule-push.png (78.7 KB) - added by 12 years ago.
- psconfig-apply.png (48.5 KB) - added by 12 years ago.
- s13.png (153.9 KB) - added by 12 years ago.
- s12.2.png (78.4 KB) - added by 12 years ago.
- s11.png (117.9 KB) - added by 12 years ago.
- s10.2.png (113.7 KB) - added by 12 years ago.
- s10.1.png (18.8 KB) - added by 12 years ago.
- s9.3.png (14.3 KB) - added by 12 years ago.
- s7.png (602.0 KB) - added by 12 years ago.
- s7.1.png (572.5 KB) - added by 12 years ago.
- s5.png (67.8 KB) - added by 12 years ago.
- s4.png (65.2 KB) - added by 12 years ago.
- s3.png (45.6 KB) - added by 12 years ago.
- s2.png (48.9 KB) - added by 12 years ago.
- s2.2.png (48.9 KB) - added by 12 years ago.
- gec14.xml (2.9 KB) - added by 12 years ago.
- userexp-iperf.png (117.6 KB) - added by 12 years ago.
- perfadmin-portal.png (284.7 KB) - added by 12 years ago.
- perfadmin-pull.png (104.9 KB) - added by 12 years ago.
- perfadmin-services.png (212.9 KB) - added by 12 years ago.
- perfadmin-psbpca.png (148.8 KB) - added by 12 years ago.
- perfadmin-owampgraph.png (172.4 KB) - added by 12 years ago.
- perfadmin-owampsingle.png (148.8 KB) - added by 12 years ago.
- perfadmin-pinger.jpg (117.4 KB) - added by 12 years ago.
- perfadmin-pinger.png (228.3 KB) - added by 12 years ago.
- S1.png (26.6 KB) - added by 12 years ago.
- s6.png (43.8 KB) - added by 12 years ago.
- down-arrow.png (1.8 KB) - added by 12 years ago.
- s12.png (78.8 KB) - added by 12 years ago.
- s9.1.png (256.3 KB) - added by 12 years ago.
- s8.png (739.4 KB) - added by 12 years ago.
- s7.2.png (846.6 KB) - added by 12 years ago.
- s9.2.png (39.6 KB) - added by 12 years ago.
- gec14img.png (24.5 KB) - added by 12 years ago.
- ondemand-bwctl.png (47.5 KB) - added by 12 years ago.
- ondemand-owping.png (75.3 KB) - added by 12 years ago.
- perfadmin-bwctl-graph.png (152.2 KB) - added by 12 years ago.
- psconfig-schedbwctl-tcpsave.png (86.6 KB) - added by 12 years ago.
- perfadmin-bwctl-query.png (207.9 KB) - added by 12 years ago.
- perfadmin-bwctl-pull.png (175.6 KB) - added by 12 years ago.
- psconfig-schedbwctl-push.png (70.7 KB) - added by 12 years ago.
- psconfig-schedbwctl-udpadd.png (43.0 KB) - added by 12 years ago.
- psconfig-schedbwctl-tcpadd.png (35.0 KB) - added by 12 years ago.
- psconfig-schedbwctl.png (92.7 KB) - added by 12 years ago.
- psconfig-usercert.png (122.0 KB) - added by 12 years ago.
- psconfig-schedule.png (99.4 KB) - added by 12 years ago.
- psconfig-schedule-pccping-add.png (100.1 KB) - added by 12 years ago.
- psconfig-schedule-pccping-save.png (52.5 KB) - added by 12 years ago.
- phoebus_log_conn.png (117.1 KB) - added by 12 years ago.
- phoebus_log_startup.png (63.8 KB) - added by 12 years ago.
- setup_netem.png (86.7 KB) - added by 12 years ago.
- iperf_phoebus.png (41.9 KB) - added by 12 years ago.
- iperf_direct.png (41.7 KB) - added by 12 years ago.