
| Version 11 (modified by , 9 years ago) (diff) |
|---|
Module C Execute Experiment (on extended topology)
3. Instrument your Application using LabWiki
In this part of Module C we will learn how to extend an OEDL script to execute an experiment on the extended topology you reserved in the previous step.
3.1 Design and Execute measurement in LabWiki
3.1.1. The "Plan" Window
Now you can use the original MD script and modify it with new information on the extended topology and the experiment you are executing on the extended topology.
Look here if you have to refresh your memory on how to use the prepare window.
TIP: To add images to your markdown script, please add a line similar to the one shown below into your .md file at the place where you want the image to appear:
<img src="http://emmy9.casa.umass.edu/GEC-20/threenoderoute.png">
The image has to be hosted on a webserver.
You can edit Markdown files in the Prepare Window.
3.1.2 The "Prepare" Window
In the Search bar in the prepare window, find the script GEC22learningswitchextend.oedl and click on it to load it. The script is also shown here for your reference:
defProperty('source1', "nodea-extend1", "ID of a resource")
defProperty('source2', "switch1-extend1", "ID of a resource")
defProperty('source3', "switch2-extend1", "ID of a resource")
peak_list = []

defProperty('sinkaddr12', '192.168.1.7', "Ping destination address")
defProperty('sinkaddr13', '192.168.1.8', "Ping destination address")

defProperty('sinkaddr21', '192.168.1.13', "Ping destination address")
defProperty('sinkaddr23', '192.168.1.14', "Ping destination address")
defProperty('sinkaddr24', '192.168.1.15', "Ping destination address")
defProperty('sinkaddr11', '192.168.1.6', "Ping destination address")

defApplication('ping') do |app|
  app.description = 'Simple Definition for the ping-oml2 application'
  # Define the path to the binary executable for this application
  app.binary_path = '/usr/local/bin/ping-oml2'
  # Define the configurable parameters for this application
  # For example if target is set to foo.com and count is set to 2, then the
  # application will be started with the command line:
  # /usr/bin/ping-oml2 -a foo.com -c 2
  app.defProperty('target', 'Address to ping', '-a', {:type => :string})
  app.defProperty('count', 'Number of times to ping', '-c', {:type => :integer})
  # Define the OML2 measurement point that this application provides.
  # Here we have only one measurement point (MP) named 'ping'. Each measurement
  # sample from this MP will be composed of a 4-tuples (addr,ttl,rtt,rtt_unit)
  app.defMeasurement('ping') do |m|
    m.defMetric('dest_addr',:string)
    m.defMetric('ttl',:uint32)
    m.defMetric('rtt',:double)
    m.defMetric('rtt_unit',:string)
  end
end

defApplication('trema') do |app|
  app.description = 'This app runs trema from command line'
  app.binary_path = '/bin/sh /root/ovs-setup2.sh'
end
defGroup('Source2', property.source2, property.source3) do |node|
  node.addApplication("trema")
end
defGroup('Source1', property.source1) do |node|
  node.addApplication("ping") do |app|
    app.setProperty('target', property.sinkaddr12)
    app.setProperty('count', 30)
    #app.setProperty('interval', 1)
    app.measure('ping', :samples => 1)
  end
  node.addApplication("ping") do |app|
    app.setProperty('target', property.sinkaddr13)
    app.setProperty('count', 30)
    #app.setProperty('interval', 1)
    app.measure('ping', :samples => 1)
  end
   node.addApplication("ping") do |app|
    app.setProperty('target', property.sinkaddr21)
    app.setProperty('count', 30)
    #app.setProperty('interval', 1)
    app.measure('ping', :samples => 1)
  end
   node.addApplication("ping") do |app|
    app.setProperty('target', property.sinkaddr23)
    app.setProperty('count', 30)
    #app.setProperty('interval', 1)
    app.measure('ping', :samples => 1)
  end
  node.addApplication("ping") do |app|
    app.setProperty('target', property.sinkaddr24)
    app.setProperty('count', 30)
    #app.setProperty('interval', 1)
    app.measure('ping', :samples => 1)
  end
end

defGroup('Source3', property.source1) do |node|
  node.addApplication("ping") do |app|
    app.setProperty('target', property.sinkaddr11)
    app.setProperty('count', 30)
    #app.setProperty('interval', 1)
    app.measure('ping', :samples => 1)
  end
end

defEvent(:MY_EVENT, every: 0.5) do
# Query for some measurements...
  # returns an array where each element is a hash representing a row from the DB
  query = ms('ping').select { [ :remote] }
  data = defQuery(query)

  triggered = false
  if !data.nil? && !(last_row = data.pop).nil? # Make sure we have some data
    next if peak_list.include?(last_row[:remote]) # Do nothing if we have seen this sample before
    if !peak_list.include?(last_row[:remote])
      peak_list << last_row[:remote] # record that sample, so we dont trigger on it again
    end
    if peak_list.include?('192.168.1.7')&&peak_list.include?('192.168.1.8')&&peak_list.include?('192.168.1.13')&&peak_list.include?('192.168.1.14')&&peak_list.include?('192.168.1.15')

      triggered = true
    end
  end
  triggered
end
onEvent :MY_EVENT do
  group('Source3').startApplications
end

onEvent(:ALL_UP_AND_INSTALLED) do |event|
  info "Starting the ping"
  after 2 do
    group('Source2').startApplications
  end
  after 20 do
    group('Source1').startApplications
  end
  after 80 do
    info "Stopping the ping"
    allGroups.stopApplications
    Experiment.done
  end
end

defGraph 'RTT' do |g|
  g.ms('ping').select(:oml_seq, :dest_addr, :rtt)
  g.caption "RTT of received packets."
  g.type 'line_chart3'
  g.mapping :x_axis => :oml_seq, :y_axis => :rtt, :group_by => :dest_addr
  g.xaxis :legend => 'oml_seq'
  g.yaxis :legend => 'rtt', :ticks => {:format => 's'}
end
3.1.3 Start your application from LabWiki
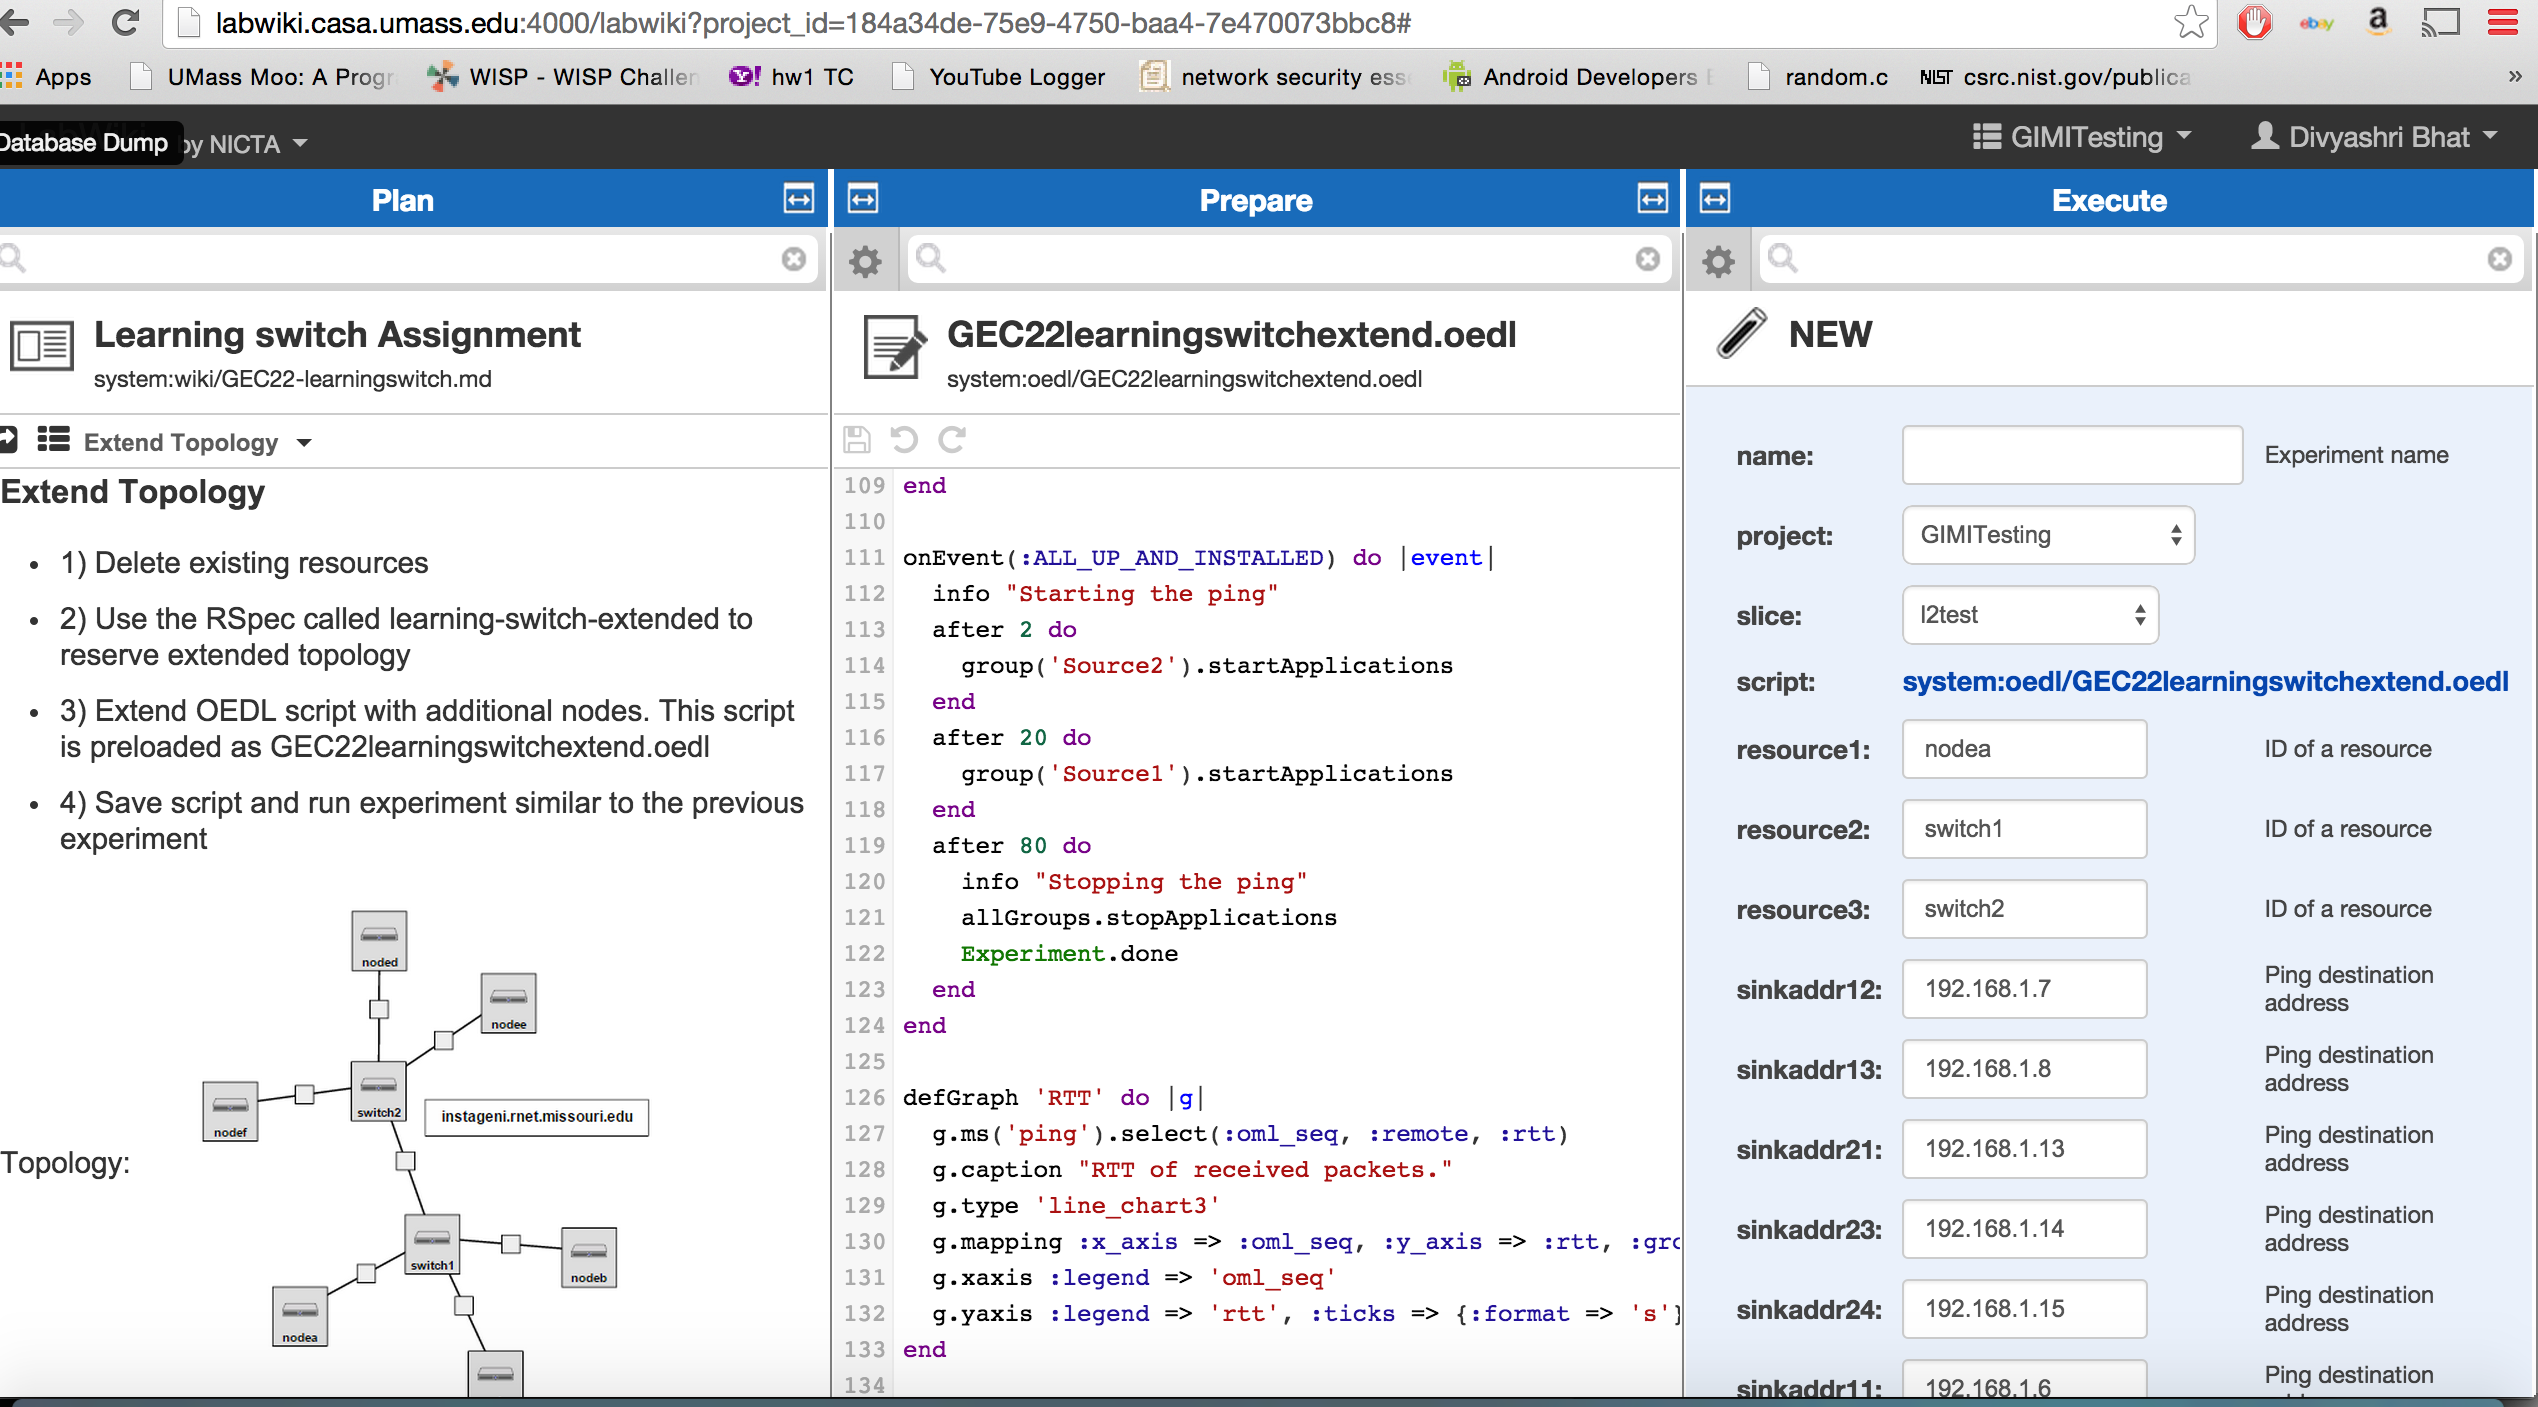
To start your experiment, simply drag the icon that is to the left of the file name (see figure below) from the middle (Prepare) to the right (Execute) window. Explanation of the fields in the Execute window:
- name: In this field you specify the name of your experiment.
- project: This pull-down menu list all the projects you are currently a member of. Select the project that contains the slice you want to run your experiment on.
- experiment context: With the context you can specify a certain set of experiments. E.g., a series of experiments you run under a certain set of startup parameters. This field is not mandatory and only necessary if you would like to save your experiment data to view later.
- slice: This pull down menu lists all slice that have been created under "project". Select the slice you would like to run your experiment on.
*Change source1 and source2 fields to include your slice name similar to nodea-<slicename>
Then, start the actual experiment by clicking on the "Start Experiment" button.

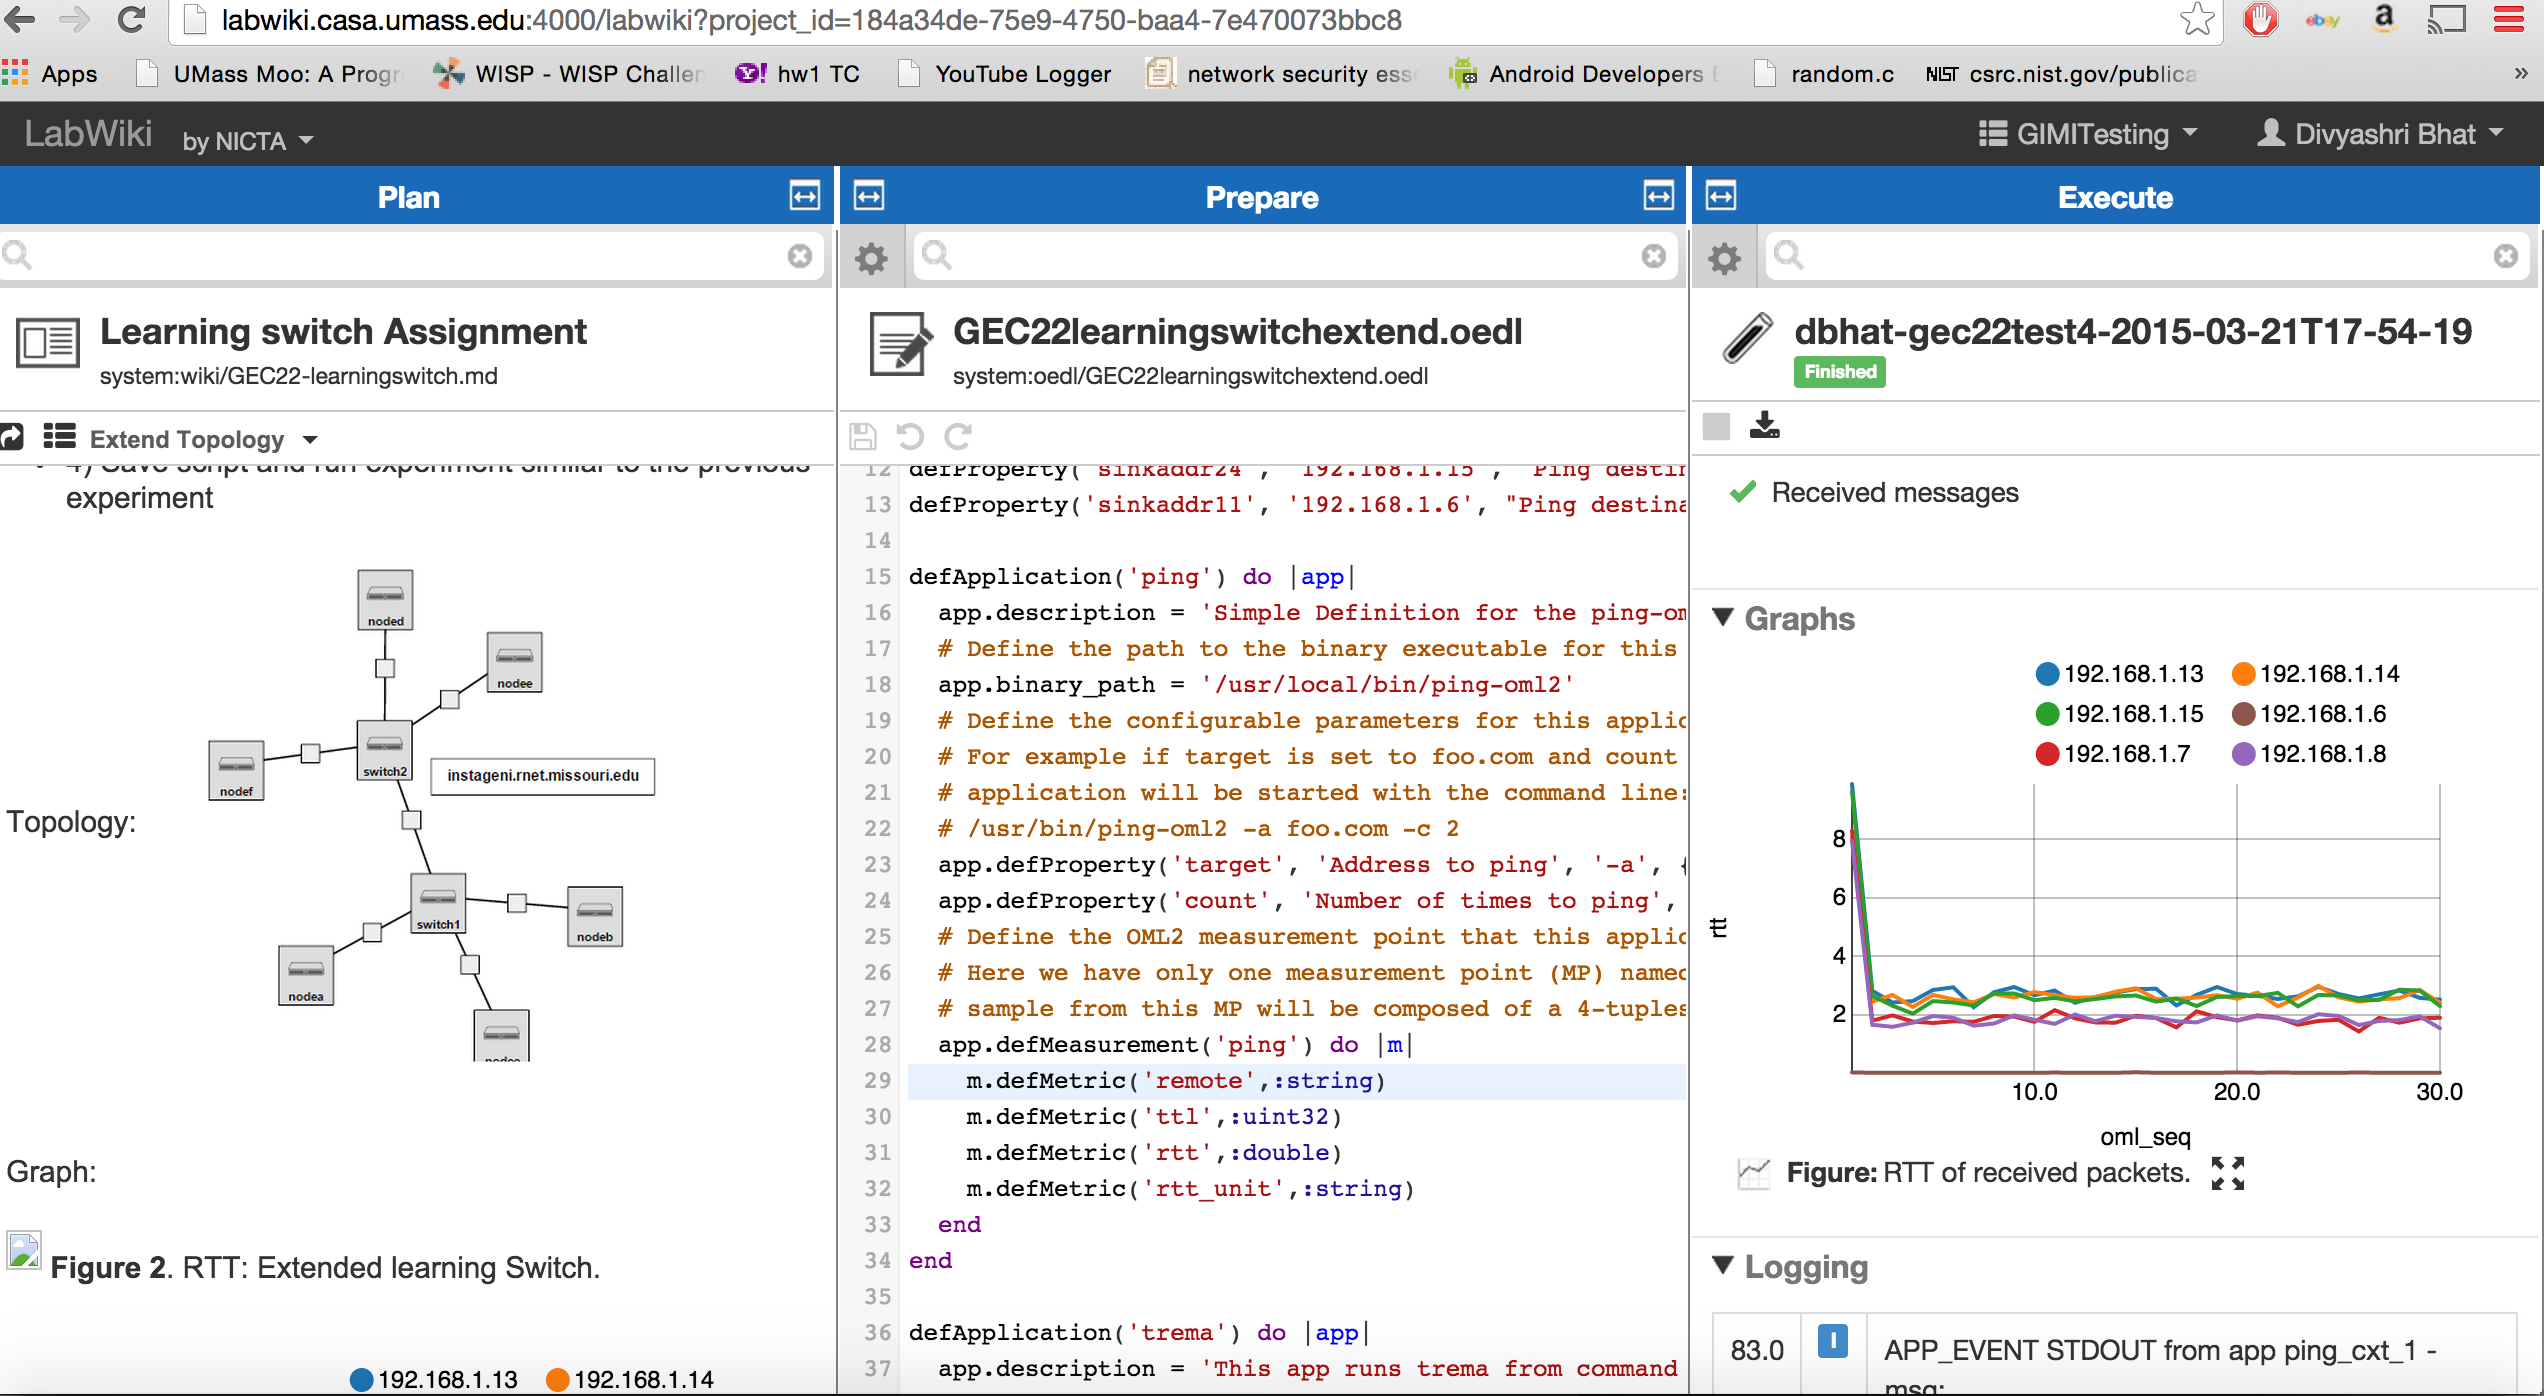
3.1.4 During experiment execution
After pressing the "Start" button, the Execute window will change and start showing status information about your experiment. The figure below gives an example for the Execute window during experiment execution.

Now the window lists experiment properties, one or several live graphs (if they have been specified in the OEDL script), and logging information. The latter would be a good starting point for trouble shooting, should your experiment not run as expected.
Depending on the status of your resources and experiments, you will see one of the following statuses at the top of the Execute window:
- Pending - This is the first state of your experiment where the job scheduler adds it to the run queue. This status would remain for the first few seconds before it changes to Running or Failed
- Running - This status appears when your experiment starts running. If it fails for one or more reasons, a Failed status will appear instead
- Aborted - When you click on "Stop Experiment" at the top-left corner of the Execute window, the status changes to aborted
- Finished - When your experiment is done, you will see this status
Note to Instructors
check http://groups.geni.net/geni/wiki/GEC22Agenda/LabWiki/ModuleA/Execute#NotetoInstructors
Next: Finish
Design
Attachments (2)
- learnswitch2.png (701.5 KB) - added by 9 years ago.
- GEC22learnswitchgraph.png (697.6 KB) - added by 9 years ago.
Download all attachments as: .zip