
| Version 35 (modified by , 10 years ago) (diff) |
|---|
OpenFlow Load Balancer Tutorial

2. Configure and Initialize Services
2.1. Start a naive OpenFlow controller
An example OpenFlow Controller that assigns incoming TCP connections to alternating paths based on total number of flows (round robin) is already downloaded for you. You can find it (load-balancer.rb) in the home directory on node "Switch".
- 2.1.1 Check that all interfaces are configured: Issue
/sbin/ifconfigand make sure eth1, eth2, eth3 are up and assigned with valid IP addresses.
- 2.1.2 Start the example Load Balancer by executing the following :
On the Aggregator Node run
    source  /etc/profile.d/rvm.sh
    trema run /tmp/aggregator/aggregator.rb >& /tmp/trema.run &
On the Switch Node run
    source  /etc/profile.d/rvm.sh
    trema run /root/load-balancer.rb
- 2.1.3 After you started your Load Balancer, you should be able to see the following (Switch id may vary):
OpenFlow Load Balancer Conltroller Started!
Switch is Ready! Switch id: 196242264273477
This means the OpenFlow Switch is connected to your controller and you can start testing your OpenFlow Load Balancer now.
2.2. Configure LabWiki to orchestrate and monitor your experiment
- 2.2.1 Log on to LabWiki on http://emmy9.casa.umass.edu:4609 , on the
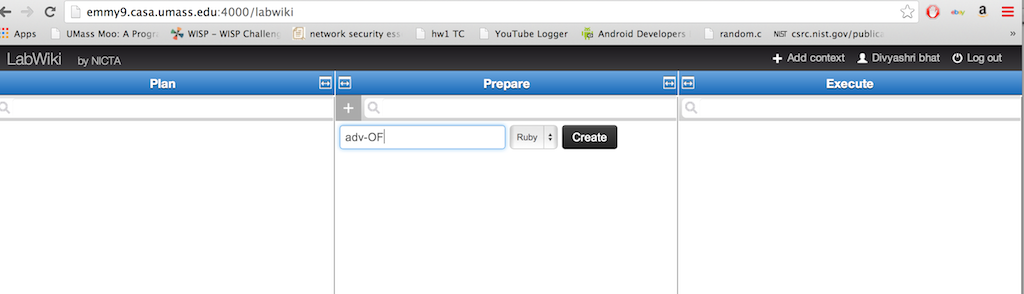
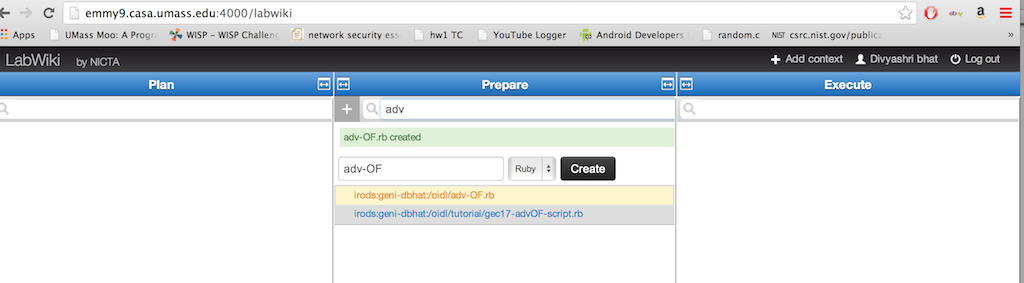
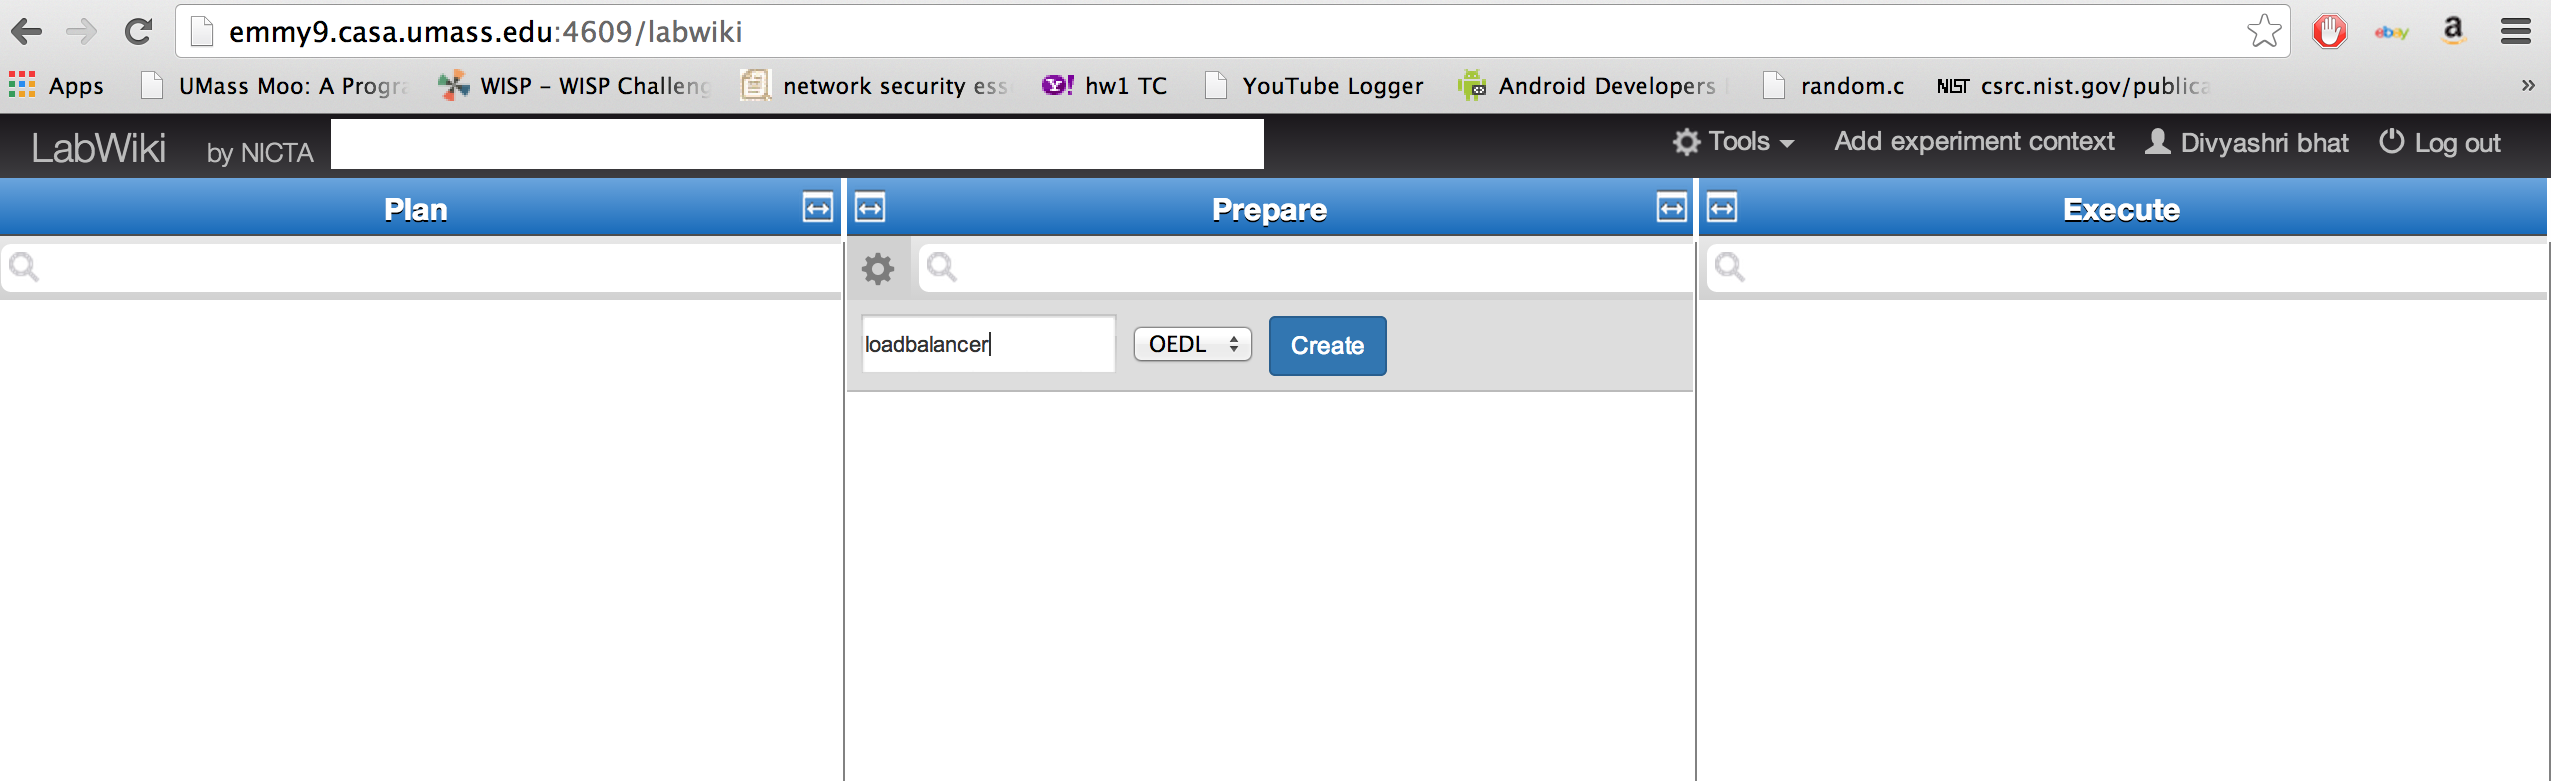
PrepareColumn, create a new Ruby script by clicking on the "*" at the top-left of the column.

Type a name for the script, eg. advOF-script and save it as an OEDL file. Enter the name of the script you just created, in the prepare column. It is now ready for editing.

For running Iperf from node "Outside" to node "Inside" and observing information about the packets that come out of the two interfaces of "Switch", add the script below to a new file, loadbalancer.rb and click on save at the top of the Prepare Column.
Note: You should change the slice name in the property bar to represent your slice name in the Execute window before you click on 'Start Experiment'.
defProperty('theSender', "outside-loadbaltest", "ID of sender node")
defProperty('theReceiver', "inside-loadbaltest", "ID of receiver node")
defProperty('theSwitch',"switch-loadbaltest","ID of switch node")
defProperty('setinterval','1.0',"Time between iperf")
defProperty('serverip', "10.10.10.2","Server interface IP")
defProperty('clientip', "10.10.10.1","Client interface IP")
defProperty('setbandwidth', "100m", "Throughput of Sender")
defApplication('trace') do |app|
  app.description = 'Packet capture'
  app.binary_path = "/usr/bin/trace-oml2"
  app.defProperty('filter', 'Filter expression BPFEXP', '-f', {:type => :string, :mnemonic => 'f'})
  app.defProperty('interface', 'Interface to trace', '-i',{:type => :string, :mnemonic => 'i', :default => '"eth0"'})
  app.defProperty('config', 'config file to follow', '--oml-config',{:type => :string, :default => '"/tmp/monitor/conf.xml"'})

app.defMeasurement("ip") do |m|
    m.defMetric('pktid',    :uint64, ' internal packet ID to link MPs')
    m.defMetric('ip_tos',   :uint32, ' Type of Service')
    m.defMetric('ip_len',   :uint32, ' Total Length')
    m.defMetric('ip_id',    :int32,  ' Identification')
    m.defMetric('ip_off',   :uint32, ' IP Fragment offset (and flags)')
    m.defMetric('ip_ttl',   :uint32, ' Time to Live')
    m.defMetric('ip_proto', :uint32, ' Protocol')
    m.defMetric('ip_sum',   :uint32, ' Checksum')
    m.defMetric('ip_src',   :string, ' Source Address')
    m.defMetric('ip_dst',   :string, ' Destination Address')
    m.defMetric('ip_sizeofpacket', :uint32, ' Size of the Packet')
    m.defMetric('ip_ts',    :double, ' timestamp of the measurement')
  end

end
defApplication('iperf') do |app|
  app.description = "Iperf is a traffic generator and bandwidth measurement
tool. It provides generators producing various forms of packet streams and port
for sending these packets via various transports, such as TCP and UDP."
  app.binary_path = "/usr/bin/iperf_oml2"

  #app.defProperty('interval', 'pause n seconds between periodic bandwidth reports', '-i',
   # :type => :double, :unit => "seconds", :default => '1.')
  app.defProperty('len', 'set length read/write buffer to n (default 8 KB)', '-l',
		  :type => :integer, :unit => "KiBytes")
  app.defProperty('print_mss', 'print TCP maximum segment size (MTU - TCP/IP header)', '-m',
		  :type => :boolean)
  app.defProperty('output', 'output the report or error message to this specified file', '-o',
		  :type => :string)
  app.defProperty('port', 'set server port to listen on/connect to to n (default 5001)', '-p',
		  :type => :integer)
  app.defProperty('udp', 'use UDP rather than TCP', '-u',
		  :type => :boolean,
		  :order => 2)
  app.defProperty('window', 'TCP window size (socket buffer size)', '-w',
		  :type => :integer, :unit => "Bytes")
  app.defProperty('bind', 'bind to <host>, an interface or multicast address', '-B',
		  :type => :string)
  app.defProperty('compatibility', 'for use with older versions does not sent extra msgs', '-C',
		  :type => :boolean)
  app.defProperty('mss', 'set TCP maximum segment size (MTU - 40 bytes)', '-M',
		  :type => :integer, :unit => "Bytes")
  app.defProperty('nodelay', 'set TCP no delay, disabling Nagle\'s Algorithm', '-N',
		  :type => :boolean)
  app.defProperty('IPv6Version', 'set the domain to IPv6', '-V',
		  :type => :boolean)
  app.defProperty('reportexclude', 'exclude C(connection) D(data) M(multicast) S(settings) V(server) reports', '-x',
		  :type => :string, :unit => "[CDMSV]")
  app.defProperty('reportstyle', 'C or c for CSV report, O or o for OML', '-y',
		  :type => :string, :unit => "[CcOo]", :default => "o") # Use OML reporting by default

  app.defProperty('server', 'run in server mode', '-s',
		  :type => :boolean)

  app.defProperty('bandwidth', 'set target bandwidth to n bits/sec (default 1 Mbit/sec)', '-b',
		  :type => :string, :unit => "Mbps")
  app.defProperty('client', 'run in client mode, connecting to <host>', '-c',
		  :type => :string,
		  :order => 1)
  app.defProperty('dualtest', 'do a bidirectional test simultaneously', '-d',
		  :type => :boolean)
  app.defProperty('num', 'number of bytes to transmit (instead of -t)', '-n',
		  :type => :integer, :unit => "Bytes")
  app.defProperty('tradeoff', 'do a bidirectional test individually', '-r',
		  :type => :boolean)
  app.defProperty('time', 'time in seconds to transmit for (default 10 secs)', '-t',
		  :type => :integer, :unit => "seconds")
  app.defProperty('fileinput', 'input the data to be transmitted from a file', '-F',
		  :type => :string)
  app.defProperty('stdin', 'input the data to be transmitted from stdin', '-I',
		  :type => :boolean)
  app.defProperty('listenport', 'port to recieve bidirectional tests back on', '-L',
		  :type => :integer)
  app.defProperty('parallel', 'number of parallel client threads to run', '-P',
		  :type => :integer)
  app.defProperty('ttl', 'time-to-live, for multicast (default 1)', '-T',
		  :type => :integer,
		  :default => 1)
  app.defProperty('linux_congestion', 'set TCP congestion control algorithm (Linux only)', '-Z',
		  :type => :boolean)

  app.defMeasurement("application"){ |m|
    m.defMetric('pid', :integer)
    m.defMetric('version', :string)
    m.defMetric('cmdline', :string)
    m.defMetric('starttime_s', :integer)
    m.defMetric('starttime_us', :integer)
  }

  app.defMeasurement("settings"){ |m|
    m.defMetric('pid', :integer)
    m.defMetric('server_mode', :integer)
    m.defMetric('bind_address', :string)
    m.defMetric('multicast', :integer)
    m.defMetric('multicast_ttl', :integer)
    m.defMetric('transport_protocol', :integer)
    m.defMetric('window_size', :integer)
    m.defMetric('buffer_size', :integer)
  }

  app.defMeasurement("connection"){ |m|
    m.defMetric('pid', :integer)
    m.defMetric('connection_id', :integer)
    m.defMetric('local_address', :string)
    m.defMetric('local_port', :integer)
    m.defMetric('remote_address', :string)
    m.defMetric('remote_port', :integer)
  }

  app.defMeasurement("transfer"){ |m|
    m.defMetric('pid', :integer)
    m.defMetric('connection_id', :integer)
    m.defMetric('begin_interval', :double)
    m.defMetric('end_interval', :double)
    m.defMetric('size', :uint64)
  }

  app.defMeasurement("losses"){ |m|
    m.defMetric('pid', :integer)
    m.defMetric('connection_id', :integer)
    m.defMetric('begin_interval', :double)
    m.defMetric('end_interval', :double)
    m.defMetric('total_datagrams', :integer)
    m.defMetric('lost_datagrams', :integer)
  }

  app.defMeasurement("jitter"){ |m|
    m.defMetric('pid', :integer)
    m.defMetric('connection_id', :integer)
    m.defMetric('begin_interval', :double)
    m.defMetric('end_interval', :double)
    m.defMetric('jitter', :double)
  }

  app.defMeasurement("packets"){ |m|
    m.defMetric('pid', :integer)
    m.defMetric('connection_id', :integer)
    m.defMetric('packet_id', :integer)
    m.defMetric('packet_size', :integer)
    m.defMetric('packet_time_s', :integer)
    m.defMetric('packet_time_us', :integer)
    m.defMetric('packet_sent_time_s', :integer)
    m.defMetric('packet_sent_time_us', :integer)
  }

end

defGroup('Servers', property.theReceiver) do |node|
  node.addApplication("iperf") do |app|
        #app.setProperty('interval', property.setinterval)
        app.setProperty('server',true)
        app.setProperty('port',6001)
        app.measure('transfer', :samples => 1)
    end
end


defGroup('Sender',property.theSender) do |node|
    node.addApplication("iperf") do |app|
        #app.setProperty('interval',property.setinterval)
        app.setProperty('client',property.serverip)
        app.setProperty('tradeoff',true)
        app.setProperty('parallel', 5)
        app.setProperty('time',30)
        app.setProperty('port',6001)
        #app.setProperty('bandwidth',property.setbandwidth)
        app.measure('transfer', :samples => 1)
    end

end
defGroup('Monitor1', property.theSwitch) do |node|
  node.addApplication("trace") do |app|
    app.setProperty("interface", 'eth1')
    app.setProperty("filter", 'tcp')
     app.setProperty("config", "/tmp/monitor/conf.xml")
    app.measure("tcp", :samples => 1)
  end
end
defGroup('Monitor', property.theSwitch) do |node|
  node.addApplication("trace") do |app|
    app.setProperty("interface", 'eth3')
    app.setProperty("filter", 'tcp')
     app.setProperty("config", "/tmp/monitor/conf.xml")
    app.measure("tcp", :samples => 1)
  end
end


onEvent(:ALL_UP_AND_INSTALLED) do |event|
    info "starting"
  group('Servers').startApplications
     after 2 do
       group('Monitor1').startApplications
       group('Monitor').startApplications
       group('Sender').startApplications
     end
    after 100 do
      group ('Sender').stopApplications
    group ('Monitor1').stopApplications
      group('Servers').stopApplications
     info "All applications stopped."
     Experiment.done
     end
end
##define the graphs that we want to display##
#defGraph 'Cumulated number of Bytes' do |g|
#  g.ms('network').select(:oml_ts_server, :tx_bytes, :oml_sender_id)
#  g.caption "Total Bytes"
#  g.type 'line_chart3'
#  g.mapping :x_axis => :oml_ts_server, :y_axis => :tx_bytes, :group_by => :oml_sender_id
#  g.xaxis :legend => 'time', :ticks => {:format => 's'}
#  g.yaxis :legend => '', :ticks => {:format => 'Byte'}
#end

defGraph 'TCP Throughput Bytes-per-Second' do |g|
  g.ms('tcp').select(:oml_ts_server, :tcp_packet_size, :oml_sender_id)
  g.caption "TCP throughput"
  g.type 'line_chart3'
  g.mapping :x_axis => :oml_ts_server, :y_axis => :tcp_packet_size, :group_by => :oml_sender_id
  g.xaxis :legend => 'time', :ticks => {:format => 's'}
  g.yaxis :legend => '', :ticks => {:format => 'Bytes/s'}
end
After your experiment is done, stop iperf servers manually. To do this, login to Nodes Outside and Inside and execute the following steps on both nodes
ps aux | grep "iperf"

root      4728  0.0  1.1 273368  6044 ?        Ssl  19:13   0:00 /usr/bin/iperf_oml2 -s -p 6001 --oml-config /tmp/51449a37-ab3e-43a3-a872-37931c7785ee-1389294789.xml
Execute
kill -9 <process_id> e.g 4278
- 2.2.2 On the terminal where you are logged in on node "Switch", rerun "ifconfig" to see the IP addresses on each interface.
 You may not be able to see all interfaces up immediately when node "Switch" is ready; wait for some more time (about 1 min) then try "ifconfig" again.
- 2.2.3 Identify the two interfaces that you want to monitor: the interfaces with IP addresses 192.168.2.1(left) and 192.168.3.1(right) respectively. On the LabWiki page, in your ruby script, find the following lines:
###### Change the following to the correct interfaces ######
left = 'eth1'
right = 'eth3'
###### Change the above to the correct interfaces ######
- 2.2.4 Change eth1 and eth3 to the corresponding two interfaces you found with IP addresses 192.168.2.1 (the interface that connects to the left path) and 192.168.3.1 (the interface that connects to the right path) and press the "save" icon on your LabWiki page.
3. Run your experiment
3.1 Start your experiment with existing configuration
- 3.1.1 Drag the
file Iconat the left-top corner on your LabWiki page fromPreparecolumn and drop it toExecutecolumn. Fill in the name of your LabWiki experiment (this can be anything that does not contain spaces, it is just to help you track the experiments you run), select your project from the drop-down list, select your slice from the list, and type "true" in the graph box to enable graphs. You can also create an experiment context if you wish to save each run of the experiment separately (Click on Add Context in the top right hand corner of the page). Then press the "Start Experiment" button. - 3.1.2 When your experiment is finished, turn off your controller and disconnect the switch from your controller:
- On node "Switch", press "Ctrl" and "c" key to kill your Load Balancer process on node "Switch"
- On node "Switch", use the following command to disconnect the OpenFlow Switch from the controller:
ovs-vsctl del-controller br0
3.2 Run the experiment in paths with different bandwidth
- 3.2.1 Log on to node "left" (use the
readyToLogin.pyscript) and change the link capacity for the interface with IP address "192.168.2.2" (use "ifconfig" to find the correct interface, here we assume eth1 is the interface connecting to node "Switch"):ovs-vsctl set Interface eth1 ingress_policing_rate=10000
The above will rate-limit the connection from node "Switch" to node "left" to have a bandwidth of 10Mbps. - Other ways to e.g., change link delay and loss-rate using "tc qdisc netem" can be found in Appendix D.
- 3.2.2 On node "Switch", start your Load Balancer using the following command:
/opt/trema-trema-f995284/trema run /root/load-balancer.rb
- 3.2.3 Start a new terminal, log onto node "Switch", use the following command to connect the OpenFlow Switch to the controller (the console window that runs your controller should display "Switch is Ready!" when the switch is connected):
ovs-vsctl set-controller br0 tcp:127.0.0.1 ptcp:6634:127.0.0.1
- 3.2.4 Go back to your LabWiki web page, drag and drop the
file iconand repeat the experiment, as described in section 3.1, using a different experiment name (the slice name should stay the same). - 3.2.5 When your experiment is finished, turn off your controller and disconnect switch from your controller:
- On node "Switch", press "Ctrl" and "c" key to kill your Load Balancer process on node "Switch"
- On node "Switch", use the following command to disconnect the OpenFlow Switch from the controller:
ovs-vsctl del-controller br0
Questions
- Did you see any difference from the graphs plotted on LabWiki, compared with the graphs plotted in the first experiment? why?
- Check out the output of the Load Balancer on node "Switch" and tell how many flows are directed to the left path and how many are on the right path, why?
- To answer the above question, you need to understand the Load Balancing controller. Check out the "load-balancer.rb" file in your home directory on node "Switch". Check Appendix A for hints/explanations about this OpenFlow Controller.
3.3 Modify the OpenFlow Controller to balance throughput among all the TCP flows
- You need to calculate the average per-flow throughput observed from both left and right paths. The modifications need to happen in the function "stats_reply" in load-balancer.rb
- In function "decide_path", change the path decision based on the calculated average per-flow throughput: forward the flow onto the path with more average per-flow throughput. (Why? TCP tries its best to consume the whole bandwidth so more throughput means network is not congested)
- If you do not know where to start, check the hints in Section 3.1.
- If you really do not know where to start after reading the hints, the answer can be found on node "Switch", at /tmp/load-balancer/load-balancer-solution.rb
- Copy the above solution into your home directory then re-do the experiment on LabWiki.
 You need to change your script to use the correct Load Balancing controller (e.g., if your controller is "load-balancer-solution.rb", you should run "/opt/trema-trema-f995284/trema run /root/load-balancer-solution.rb")
- Reren the experiment using your new OpenFlow Controller following steps in Section 2.5, check the graphs plotted on LabWiki as well as the controller's log on node "Switch" and see the difference.
- When your experiment is done, you need to stop the Load Balancer:
- On node "Switch", use the following command to disconnect the OpenFlow Switch from the controller:
ovs-vsctl del-controller br0
- On node "Switch", press "Ctrl" and "c" key to kill your Load Balancer process on node "Switch"
- On node "Switch", use the following command to disconnect the OpenFlow Switch from the controller:

3.4 Automate your experiment using LabWiki
- 3.4.1 Add code in your LabWiki script to automate starting and stopping your OpenFlow Controller:
- 3.4.1.1 Go back to your LabWiki page, un-comment the script from line 184 to line 189 to start your OpenFlow Controller automatically on LabWiki
You might need to change line 185 to use the correct load balancer controller
- 3.4.1.2 In your script, uncomment lines 205 to line 209 to stop your OpenFlow Controller automatically on LabWiki
- 3.4.1.1 Go back to your LabWiki page, un-comment the script from line 184 to line 189 to start your OpenFlow Controller automatically on LabWiki
- 3.4.2 On your LabWiki web page, drag and drop the
file iconand repeat the experiment, as described in section 3.1, using a different experiment name (the slice name should stay the same). - If you have more time or are interested in trying out things, go ahead and try section 3.5. The tutorial is over now and feel free to ask questions :-)
3.5(Optional) Try different kinds of OpenFlow Load Balancers
- You can find more load balancers under /tmp/load-balancer/ on node "Switch"
- To try out any one of them, follow the steps:
- At the home directory on node "Switch", copy the load balancer you want to try out, e.g.,
cp /tmp/load-balancer/load-balancer-random.rb /root/
- Change your LabWiki code at line 185 to use the correct OpenFlow controller.
- On LabWiki, drag and drop the "File" icon and re-do the experiment as described in section 3.1
- At the home directory on node "Switch", copy the load balancer you want to try out, e.g.,
- Some explanations about the different load balancers:
- "load-balancer-random.rb" is the load balancer that picks path randomly: each path has 50% of the chance to get picked
- "load-balancer-roundrobin.rb" is the load balancer that picks path in a round robin fashion: right path is picked first, then left path, etc.
- Load balancers that begin with "load-balancer-bytes" picks path based on the total number of bytes sent out to each path: the one with fewer bytes sent out is picked
- "load-balancer-bytes-thread.rb" sends out flow stats request in function "packet_in" upon the arrival of a new TCP flow and waits until flow stats reply is received in function "stats_reply" before a decision is made. As a result, this balancer gets the most up-to-date flow stats to make a decision. However, it needs to wait for at least the round-trip time from the controller to the switch (for the flow stats reply) before a decision can be made.
- "load-balancer-bytes-auto-thread.rb" sends out flow stats request once every 5 seconds in a separate thread, and makes path decisions based on the most recently received flow stats reply. As a result, this balancer makes path decisions based on some old statistics (up to 5 seconds) but reacts fast upon the arrival of a new TCP flow (i.e., no need to wait for flow stats reply)
- Load balancers that begin with "load-balancer-flows" picks path based on the total number of flows sent out to each path: the one with fewer flows sent out is picked
- Load balancers that begin with "load-balancer-throughput" picks path based on the total throughput sent out to each path: the one with more throughput is picked
Appendix: Hints and Explanations
A. About the OpenFlow controller load-balancer.rb
- Trema web site: http://trema.github.io/trema/
- Treme ruby API document: http://rubydoc.info/github/trema/trema/master/frames
- Functions used in our tutorial:
- start(): is the function that will be called when the OpenFlow Controller is started. Here in our case, we read the file /tmp/portmap and figures out which OpenFlow port points to which path
- switch_ready(): is the function that will be called each time a switch connects to the OpenFlow Controller. Here in our case, we allow all non-TCP flows to pass (including ARP and ICMP packets) and ask new inbound TCP flow to go to the controller. We also starts a "timer" function that calls "query_stats()" once every 2 seconds.
- query_stats(): is the function that sends out a flow_stats_request to get the current statistics about each flow.
- packet_in(): is the function that will be called each time a packet arrives at the controller. Here in our case, we call "decide_path()" to get path decisions, then send flow entry back to the OpenFlow Switch to instruct the switch which path to take for this new TCP flow.
- stats_reply(): is the function that will be called when the OpenFlow Controller receives a flow_stats_reply message from the OpenFlow Switch. Here in our case, we update the flow statistics so that "decide_path()" can make the right decision.
- send_flow_mod_add(): is the function that you should use to add a flow entry into an OpenFlow Switch.
- decide_path(): is the function that makes path decisions. It returns the path choices based on flow statistics.
- The Whole Process:
- When the OpenFlow switch is ready, our controller starts a function that asks for flow stats once every 2 seconds.
- The OpenFlow switch will reply with statistics information about all flows in its flow table.
- This flow statistics message will be fetched by the "stats_reply" function in the OpenFlow controller implemented by the user on node "Switch".
- As a result, our controller updates its knowledge about both left and right path once every 2 seconds.
- Upon the arrival of a new TCP flow, the OpenFlow controller decides which path to send the new flow to, based on the updated flow statistics.
The FlowStatsReply message is in the following format:
FlowStatsReply.new(
  :length => 96,
  :table_id => 0,
  :match => Match.new
  :duration_sec => 10,
  :duration_nsec => 106000000,
  :priority => 0,
  :idle_timeout => 0,
  :hard_timeout => 0,
  :cookie => 0xabcd,
  :packet_count => 1,
  :byte_count => 1,
  :actions => [ ActionOutput.new ]
)
B. About The Rspec file OpenFlowLBExo.rspec
- The Rspec file describes a topology we showed earlier--each node is assigned with certain number of interfaces with pre-defined IP addresses
- Some of the nodes are loaded with softwares and post-scripts. We will take node "Switch" as an example since it is the most complicated one.
- The following section in the Rspec file for node "Switch":
  <install url="http://www.gpolab.bbn.com/experiment-support/OpenFlowExampleExperiment/software/of-switch-exo.tar.gz"
                      install_path="/"/>
means it is going to download that tar ball from the specified URL and extract to directory "/" - The following section in the Rspec file for node "Switch":
  <execute shell="bash" command="/tmp/postboot_script_exo.sh $sliceName $self.Name() ;
                        /tmp/of-topo-setup/lb-setup"/>
names the post-boot script that ExoGENI is going to run for you after the nodes are booted.
- The following section in the Rspec file for node "Switch":
- More information about "/tmp/postboot_script_exo.sh": It is a "hook" to the LabWiki interface. Experimenter run this so that LabWiki knows the name of the slice and the hostname of the particular node that OML/OMF toolkits are running on.
- More information about "/tmp/of-topo-setup/lb-setup":
"lb-setup" is to setup the load balancing switch. The source code as well as explanation is as follows:
#!/bin/sh

/tmp/of-topo-setup/prep-trema       # install all libraries for trema
/tmp/of-topo-setup/ovs-start           # create ovs bridge

cp /usr/bin/trace-oml2 /usr/bin/trace        # a hack to the current LabWiki --> needs to be fixed
cp /usr/bin/nmetrics-oml2 /usr/bin/nmetrics       # a hack to the current LabWiki --> needs to be fixed
# download the load balancing openflow controller source code to user directory
wget http://www.gpolab.bbn.com/experiment-support/OpenFlowExampleExperiment/ExoGENI/load-balancer.rb -O /root/load-balancer.rb

INTERFACES="192.168.1.1 192.168.2.1 192.168.3.1"

# wait until all interfaces are up, then fetch the mapping from interface name to its ip/MAC address and save this info in a file /tmp/ifmap
/tmp/of-topo-setup/writeifmap3

# add port to the ovs bridge
/tmp/of-topo-setup/find-interfaces $INTERFACES | while read iface; do
    ovs-vsctl add-port br0 $iface < /dev/null
done

# create port map save it to /tmp/portmap
ovs-ofctl show tcp:127.0.0.1:6634 \
    | /tmp/of-topo-setup/ovs-id-ports 192.168.1.1=outside 192.168.2.1=left 192.168.3.1=right \
    > /tmp/portmap
C. About the GIMI script you run on LabWiki
- Line 1 to Line 128: the definition of oml trace and oml nmetrics library. It basically defines the command line options for oml2-trace and oml2-nmetrics, as well as the output (the monitoring data that is going to be stored into the oml server)
- users are not supposed to modify them
- the definition here we used is not the same as what is provided by the latest OML2 2.10.0 library because there is some version mis-match between the OMF that LabWiki is using and the OML2 toolkit that we are using. It is a temporary hack for now --> to be fixed
- we added the definition of option "--oml-config" for trace app (Line 27-28) so that oml2-trace accepts configuration files:
app.defProperty('config', 'config file to follow', '--oml-config',
                :type => :string, :default => '"/tmp/monitor/conf.xml"')
- Line 134 to Line 137: user defines the monitoring interfaces here. In our case, we want to monitor the interface on node "Switch" that connects to the left path (with IP 192.168.2.2) and to the right path (with IP 192.168.3.1)
- Line 139 to Line 169: defines on which node the user wants to run which monitoring app; and the "display graph" option.
- group "Monitor" monitors the left path statistics using nmetrics and trace.
- group "Monitor1" monitors the right path statistics using nmetrics and trace.
- To monitor the throughput information, we used oml2-trace with the option of "--oml-config" which uses the configuration file we created at /tmp/monitor/conf.xml, which simply sums up the number of tcp_packet_size (in Bytes) for each second and save the info into the OML Server (in a Postgre database):
<omlc id="switch" encoding="binary"> <collect url="tcp:emmy9.casa.umass.edu:3004" name="traffic"> <stream mp="tcp" interval="1"> <filter field="tcp_packet_size" operation="sum" rename="tcp_throughput" /> </stream> </collect> </omlc> - More information about nmetrics and trace can be found here: http://oml.mytestbed.net/projects/omlapp/wiki/OML-instrumented_Applications#Packet-tracer-trace-oml2
- Line 173 to Line 218: defines the experiment:
- Line 175-177: starts the monitoring app
- Line 179-181: starts the TCP receiver (using iperf)
- Line 183-189: starts the load balancer and connects ovs switch to the load balancer (controller)
- Line 191-200: starts 20 TCP flows, with 5 seconds interval between the initial of each Flow
- Line 205-209: stop the load balancer controller, disconnect the ovs switch from the controller and finish the experiment
- Line 217 to Line 234: defines the two graphs we want to plot:
- The first uses the monitoring data from oml2-nmetrics to display the cumulated number of bytes observed from each of the interfaces;
- The second graph uses the monitoring results from oml2-trace to display the throughput observed from each of the interfaces.
D. Tips: Debugging an OpenFlow Controller
You will find it helpful to know what is going on inside your OpenFlow controller and its associated switch when implementing these exercises.
This section contains a few tips that may help you out if you are using the Open vSwitch implementation provided with this tutorial.
If you are using a hardware OpenFlow switch, your instructor can help you find equivalent commands.
The Open vSwitch installation provided by the RSpec included in this tutorial is located in /opt/openvswitch-1.6.1-F15. You will find Open vSwitch commands in /opt/openvswitch-1.6.1-F15/bin and /opt/openvswitch-1.6.1-F15/sbin. Some of these commands may be helpful to you. If you add these paths to your shell’s $PATH, you will be able to access their manual pages with man. Note that $PATH will not affect sudo, so you will still have to provide the absolute path to sudo; the absolute path is omitted from the following examples for clarity and formatting.
- ovs-vsctl
Open vSwitch switches are primarily configured using the ovs-vsctl command. For exploring, you may find the ovs-vsctl show command useful, as it dumps the status of all virtual switches on the local Open vSwitch instance. Once you have some information on the local switch configurations, ovs-vsctl provides a broad range of capabilities that you will likely find useful for expanding your network setup to more complex configurations for testing and verification. In particular, the subcommands add-br, add-port, and set-controller may be of interest. - ovs-ofctl
The switch host configured by the given rspec listens for incoming OpenFlow connections on localhost port 6634. You can use this to query the switch state using the ovs-ofctl command. In particular, you may find the dump-tables and dump-flows subcommands useful. For example, sudo ovs-ofctl dump-flows tcp:127.0.0.1:6634 will output lines that look like this:cookie=0x4, duration=6112.717s, table=0, n packets=1, n bytes=74, idle age=78,priority=5,tcp, nw src=10.10.10.0/24 actions=CONTROLLER:65535
This indicates that any TCP segment with source IP in the 10.10.10.0/24 subnet should be sent to the OpenFlow controller for processing, that it has been 78 seconds since such a segment was last seen, that one such segment has been seen so far, and the total number of bytes in packets matching this rule is 74. The other fields are perhaps interesting, but you will probably not need them for debugging. (Unless, of course, you choose to use multiple tables — an exercise in OpenFlow 1.1 functionality left to the reader.) - Unix utilities
You will want to use a variety of Unix utilities, in addition to the tools listed in ExerciseLayout, to test your controllers. The standard ping and /usr/sbin/arping tools are useful for debugging connectivity (but make sure your controller passes ICMP ECHO REQUEST and REPLY packets and ARP traffic, respectively!), and the command netstat -an will show all active network connections on a Unix host; the TCP connections of interest in this exercise will be at the top of the listing. The format of netstat output is out of the scope of this tutorial, but information is available online and in the manual pages. - Linux netem
Use the tc command to enable and configure delay and lossrate constraints on the outgoing interfaces for traffic traveling from the OpenFlow switch to the Aggregator node. To configure a path with a 20 ms delay and 10% lossrate on eth2, you would issue the command:sudo tc qdisc add dev eth2 root handle 1:0 netem delay 20ms loss 2%
Use the "tc qdisc change" command to reconfigure existing links,instead of "tc qdisc add".
Introduction
Next: Teardown Experiment
Attachments (8)
- OpenFlowLBExo.png (63.8 KB) - added by 11 years ago.
- LabWiki_newscript.png (98.5 KB) - added by 10 years ago.
- LabWiki_newscriptsel.png (115.0 KB) - added by 10 years ago.
- labwikinew.png (213.4 KB) - added by 10 years ago.
- labwikinew2.png (220.9 KB) - added by 10 years ago.
- FindAM.png (666.0 KB) - added by 10 years ago.
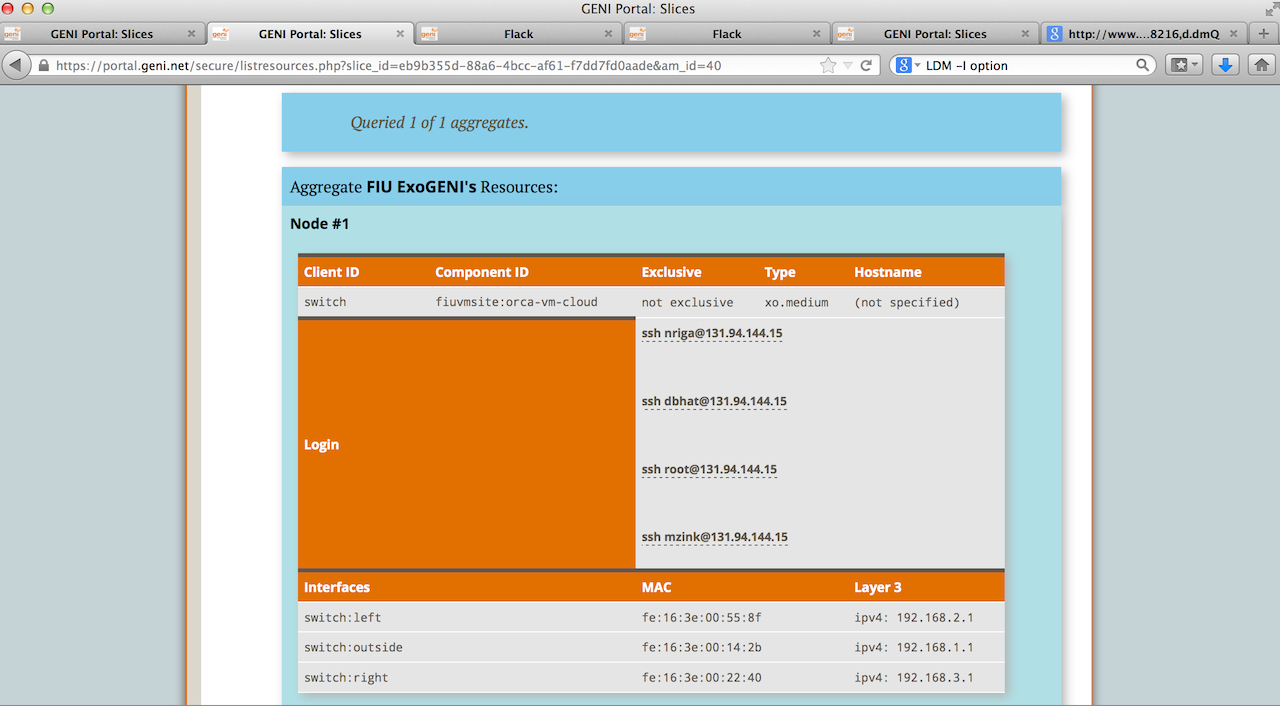
- LoginAM.png (257.6 KB) - added by 10 years ago.
- editscriptLW.png (286.3 KB) - added by 10 years ago.
Download all attachments as: .zip