
| Version 23 (modified by , 11 years ago) (diff) |
|---|
Revise, Repeat
After looking at the measurements collected by the 'wxmstat' application, we realize that the signal strength on the nodes is too high. The WiMAX CINR (a measure of signal quality) is 30 dB, which is very high, and so the maximum number of SVC layers (2) is downloaded in all cases. We want a more realistic environment, so we turn down the base station transmit power from 40 dBm to 35 dBm:
wget -qO- "http://wimaxrf:5052/wimaxrf/bs/set?bs_tx_power=35"
wget -qO- "http://wimaxrf:5052/wimaxrf/bs/restart"
Confirm that the base station power is now set to 35:
wget -qO- "http://wimaxrf:5052/wimaxrf/bs/get?bs_tx_power" | xml_pp
should output:
<STATUS>
  <BaseStation>
    <bs_tx_power>
      <bs_tx_power>35</bs_tx_power>
    </bs_tx_power>
  </BaseStation>
</STATUS>
He also uses the programmable attenuation on Sandbox 4 to create a situation where signal strength varies over the duration of the experiment. To do this, he adds some properties to the beginning of his experiment:
defProperty('attUrl', "http://internal2dmz.orbit-lab.org:5054/instr/set?", "Path to use to set attenuation")
and changes the sequence of events in the experiment to look like this:
onEvent(:ALL_UP_AND_INSTALLED) do |event|
  l =  [5,6,7,4,3,6,10,11,12,8,7,9,5,3,5,6,7,4,3,6,10,11,12,8,7,9,5,3]
  wait 5
  system("/home/#{ENV['USER']}/getbsconf -i wimaxrf --oml-server tcp:oml:3003 --oml-id console --oml-exp-id #{Experiment.ID}")
  group("server").exec("/usr/bin/python -m SimpleHTTPServer")
  group("client1").startApplications
  l.each do |a|
    system("/usr/bin/wget -qO- \"#{property.attUrl}portA=#{property.client1}\&portB=9\&att=#{a}\"")
    wait 5
  end
  group("client1").stopApplications
  wait 5
  group("client2").startApplications
  l.each do |a|
    system("/usr/bin/wget -qO- \"#{property.attUrl}portA=#{property.client2}\&portB=9\&att=#{a}\"")
    wait 5
  end
  group("client2").stopApplications
  wait 5
  allGroups.stopApplications
  Experiment.done
end
The effect of this is to change the attenuation between the WiMAX BS and the client in a fixed sequence every five seconds during the experiment.
After running this modified experiment with
omf exec wmxtutor-streamload2.rb
and pushing the data and log files to iRODs:
iarchive -e expID -c streamload
try creating the same plots as before from the new expID.sq3 file:
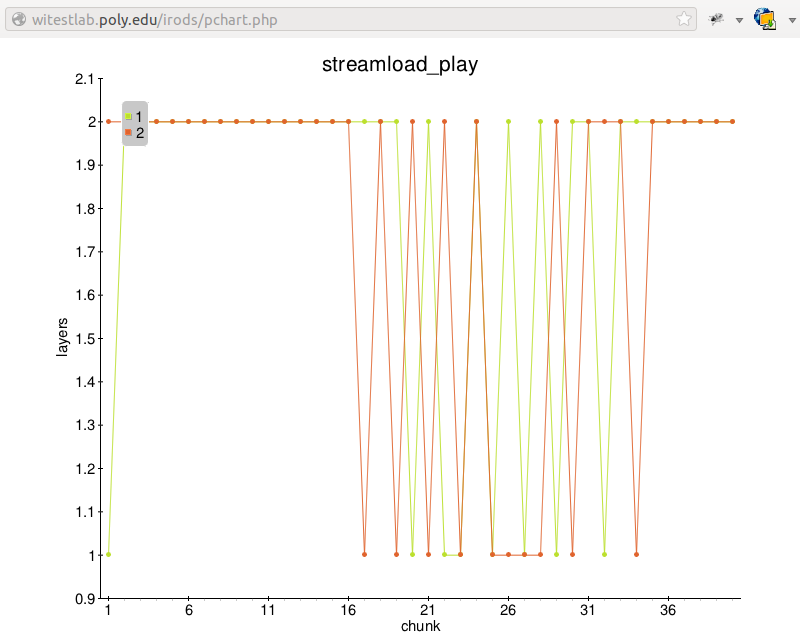
- Plot table 'streamload_play' with 'chunk' on the x-axis, 'layer' on the y-axis, and group by 'oml_sender_id'. This will show you the number of layers downloaded for each of the 40 video segments, for each client.
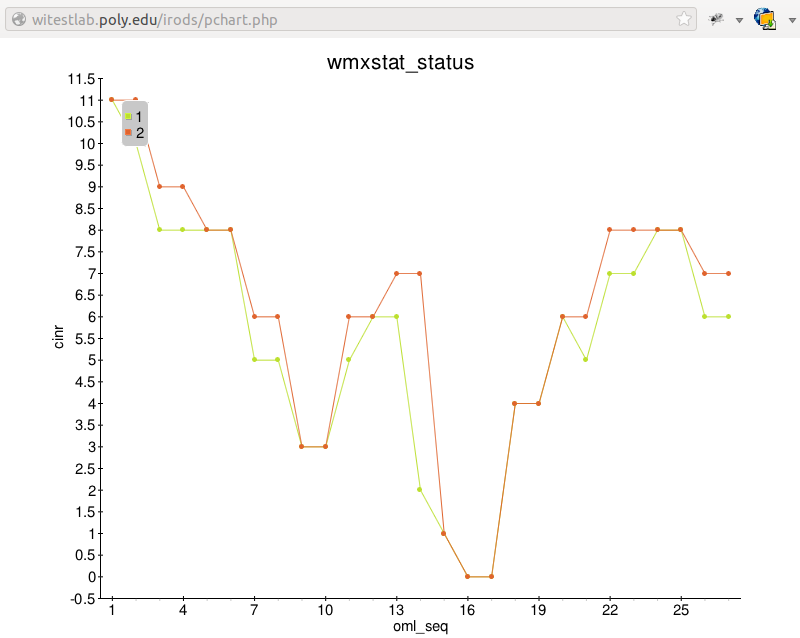
- Plot table 'wmxstat_status' with 'oml_seq' on the x-axis, 'cinr' on the y-axis, and group by 'oml_sender_id'. This will show you the WiMAX link quality as measured at each node for the duration of the experiment.
He looks at the iRODS plot and is happy with the result.
Attachments (2)
- wmxstat-sl-dynamic.png (48.2 KB) - added by 11 years ago.
- play-sl-dynamic.png (48.6 KB) - added by 11 years ago.
Download all attachments as: .zip