
| Version 2 (modified by , 10 years ago) (diff) |
|---|
GENI Aggregate Usage Statistics For InstaGENI Compute Resources
The plots below capture the usage of InstaGENI compute resources at GENI aggregates as reported by the GENI Meta Operations Center (GMOC). The plots are divided into three categories:
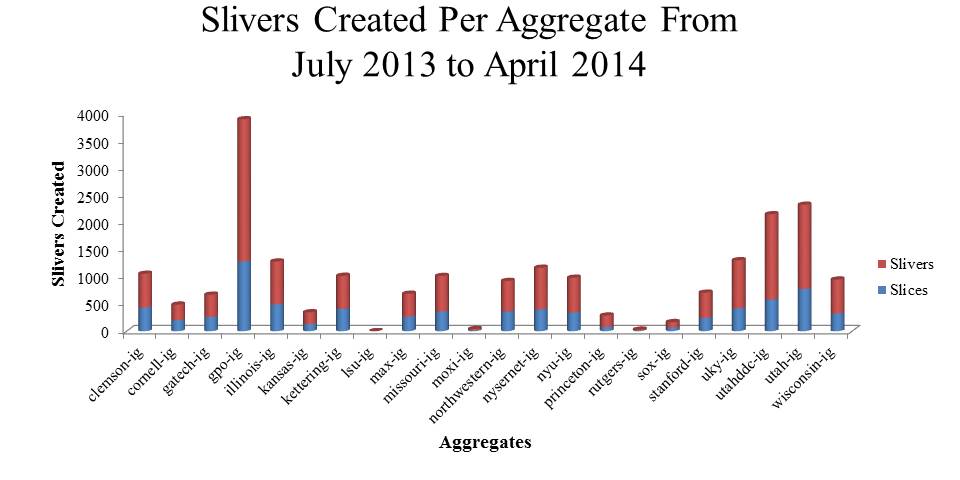
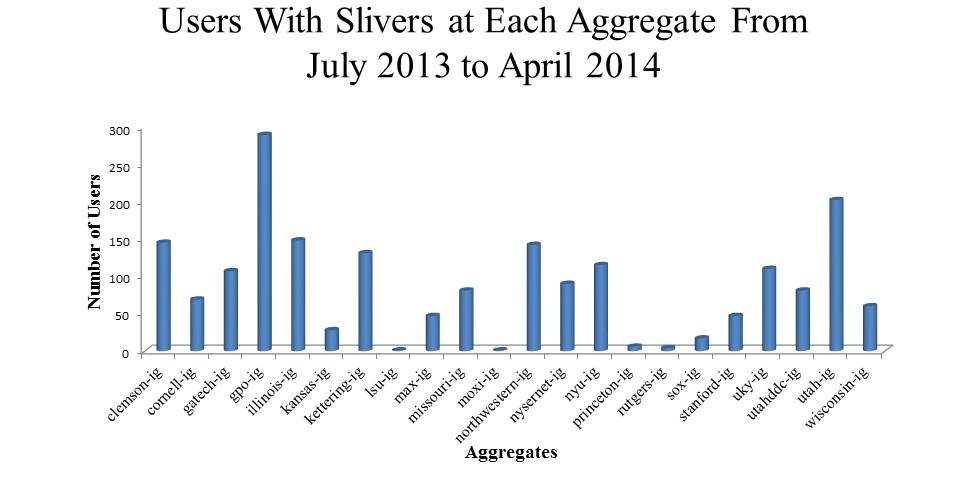
- Report From GEC17 Through April 2014: considers data from GEC 17 (i.e. July 2013, the initial month when data collection was determined) to April 2014.
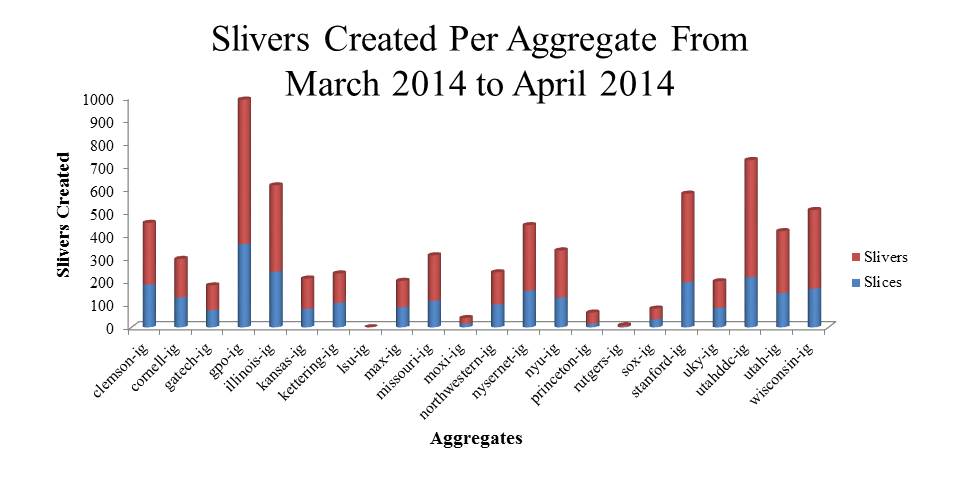
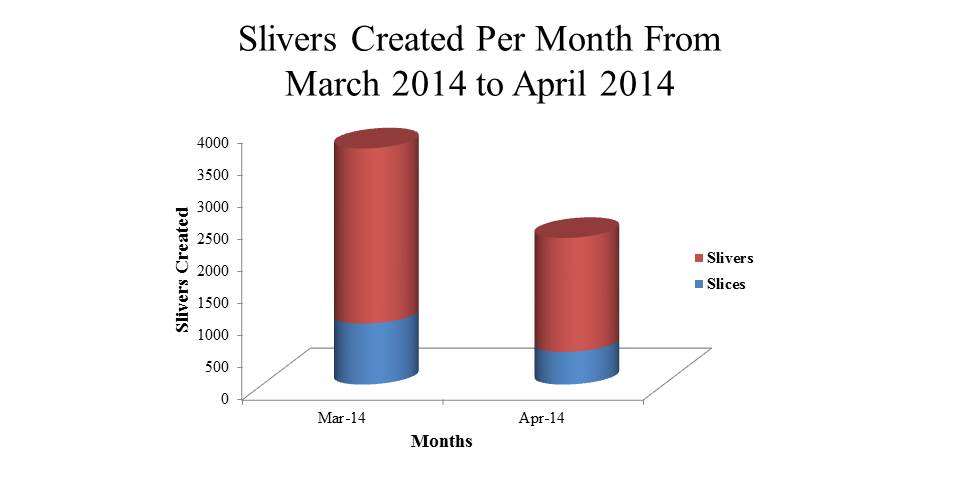
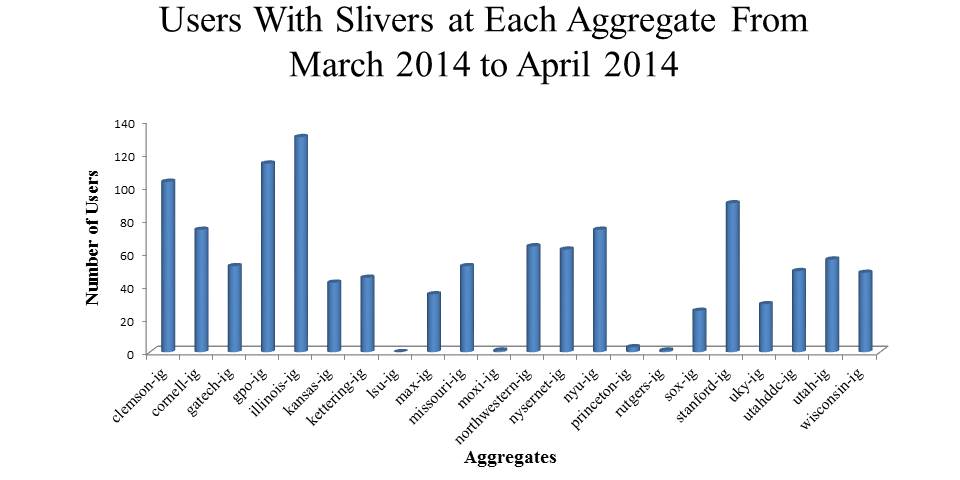
- Report From Last GEC (GEC19) Through April 2014: considers data from the last GEC through April 2014
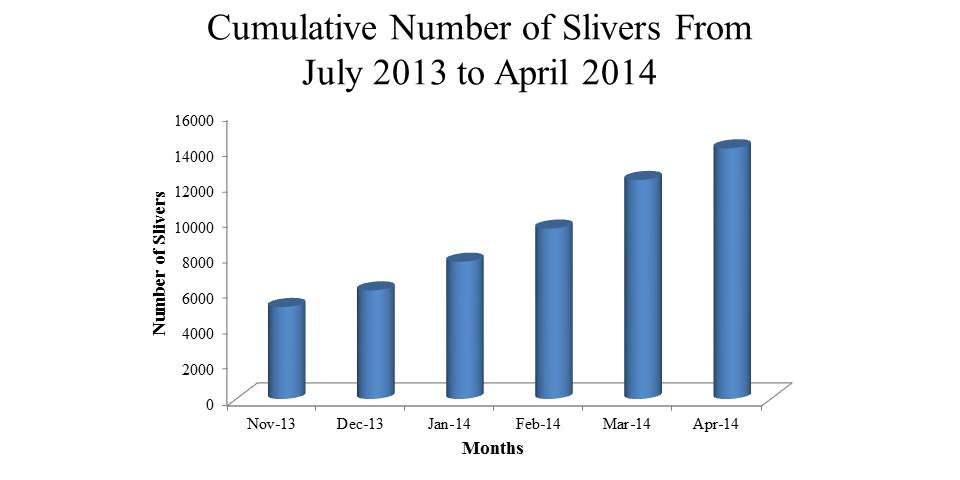
- Cumulative Report From GEC17 Through April 2014: considers the cumulative dataset from GEC17 to April 2014
Report From GEC17 Through April 2014


Report From Last GEC (GEC19) Through April 2014


Cumulative Report From GEC17 Through April 2014


Attachments (9)
- cumulativeSliversPerMonthJuly13ToApr14.jpg (31.6 KB) - added by 10 years ago.
- cumulativeUsersPerMonthJuly13ToApr14.jpg (30.2 KB) - added by 10 years ago.
- sliversPerAggJuly13ToApr14.jpg (42.4 KB) - added by 10 years ago.
- sliversPerAggMar14ToApr14.jpg (44.7 KB) - added by 10 years ago.
- sliversPerMonthMar14ToApr14.jpg (27.5 KB) - added by 10 years ago.
- sliversPerMonthMar14ToApr14.2.jpg (27.5 KB) - added by 10 years ago.
- usersPerAggJuly13ToApr14.jpg (42.1 KB) - added by 10 years ago.
- usersPerAggMar14ToApr14.jpg (44.2 KB) - added by 10 years ago.
- sliversPerMonthJuly13ToApr14.jpg (34.5 KB) - added by 10 years ago.
Download all attachments as: .zip