
| Version 10 (modified by , 11 years ago) (diff) |
|---|
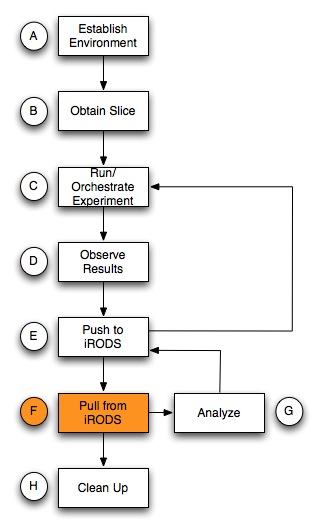
F. Analyze

In Section F we went through the exercise of retrieving data from iRODS to a local computer. In this Section, we will introduce two different methods that can be used to analyze the measurement data. Analysis of measurement data obtained with OMF/OML is not limited to these two methods, we simply use them for demonstration purposes.
G.1 R Scripts
One potential way to visualize the data is making use of R, which provides a visualization language. For this tutorial, we have create a set of R script, which we briefly discuss in the following.
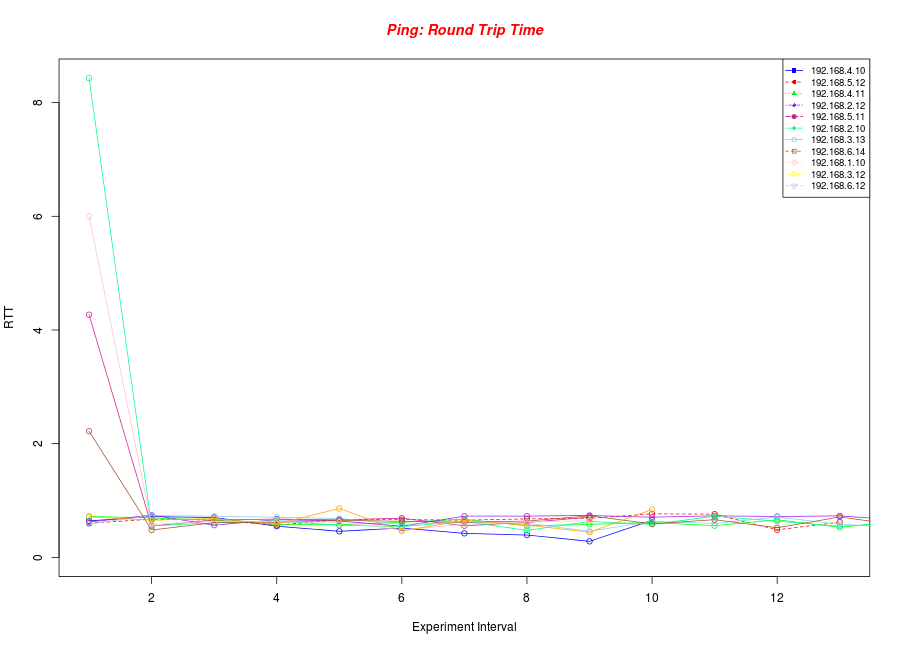
The first script creates a plot of the RTTs for each ping that's carried out in the experiment. The following code snipped shows part of the R script that is used to plot a single ping (to 192.168.2.10).
library(RSQLite)
con <- dbConnect(dbDriver("SQLite"), dbname = "gimi30-ping_all.sq3")
dbListTables(con)
dbReadTable(con,"pingmonitor_myping")
mydata <- dbGetQuery(con, "select dest_addr,rtt from pingmonitor_myping where dest_addr='192.168.4.10'")
rtt <- mydata$rtt
pdf("gimi31_ping1.pdf")
plot(rtt,type="o",col="red",xlab="Experiment Interval",ylab="RTT (ms)")
title(main="Ping Experiment to IP address 192.168.4.10", col.main="blue", font.main=4)
G.2 omf_web
5) Analyze and visualize measurement results after completing run of experiment
- if necessary, retrieve measurement results from archive service
- analyze and format results as desired, for visualization with presentation service
- as appropriate, store analyzed results and/or visualization in storage service
http://groups.geni.net/geni/wiki/GIMIv1.1Tutorial/Toirods Back to previous step
http://groups.geni.net/geni/wiki/GIMIv1.1Tutorial/Fromirods Forward to next step
http://groups.geni.net/geni/wiki/GIMIv1.1Tutorial/ Back to tutorial main page
Attachments (4)
-
GIMI_workflow_F.jpg (39.3 KB) - added by 12 years ago.
Workflow F
- gimi20-nmetrics-eth.png (31.6 KB) - added by 11 years ago.
- gimi20_otg1.png (29.8 KB) - added by 11 years ago.
- gimi20-ping.png (42.9 KB) - added by 11 years ago.
Download all attachments as: .zip