
Monitor installed flow entries
Now that we have installed two different paths of communication between two hosts, it is important to know if they are properly routed, and how much traffic is being sent. To that extent, the GENI Desktop provides two complimentary live monitoring frameworks in the form of modules, the Flow Monitor module and the Passive Graph module(s).
We will use the Flow Monitor module in this experiment.
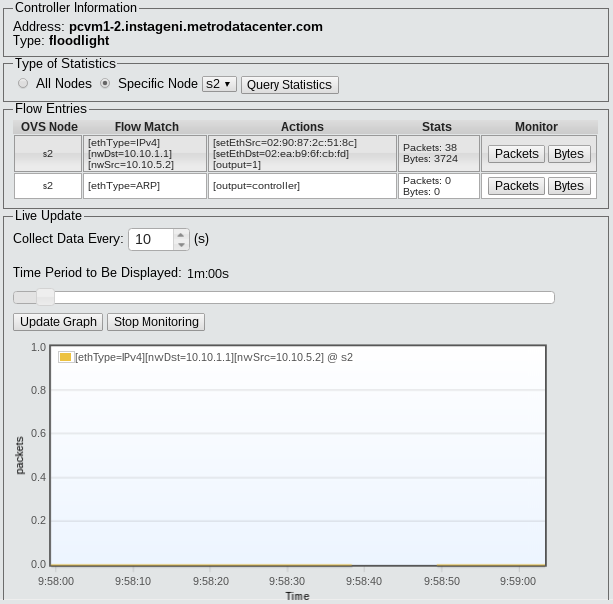
This module allows you make flow-rule-wise statistic collection. The flow entries can be queried globally or on a per node basis. After the table is loaded with flow entries, you may collect data based on amount of packets or the amount of bytes that match the selected flow entry.
We will query information from switch s2, and will start monitoring the amount of packets received in the flow-entry that we installed above (i.e. the one different from ARP traffic).

You can adjust the parameters at will to zoom in or zoom out the live graph. Now lets generate some traffic.
h1 terminal: Start netcat server on port 3000.
user@h1:~$ nc -l 3000
this
is a test
h2 terminal: Connect to the netcat server at h1:3030.
user@h2:~$ nc h1 3000
this
is a test
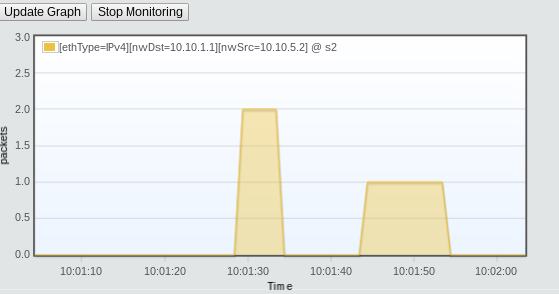
Type one or two words/sentences then press ENTER on h2, and check the monitoring graph. Also note that the communication is successful since all the words sent from h2 appear on h1 's terminal.

Type more words (as many as you want) and check again. You can see how the shape of the graph changes based on the amount of packets received at the switch that match that rule.
Stop the netcat server by pressing CTRL+C
Navigation: Back To Tutorial
Attachments (2)
- monitortable.png (48.6 KB) - added by 8 years ago.
- monitorgraph.png (17.1 KB) - added by 8 years ago.
Download all attachments as: .zip