
| Version 8 (modified by , 11 years ago) (diff) |
|---|
Navigation: Up
BLiPP and NetLogger: Access active measurement probe data
Overview
The goal of this exercise is to configure BLiPP (Basic Lightweight Periscope Probes) and enable active measurements within your slice. An example NetLogger script will be used to generate data that will be collected with an active BLiPP probe.
The role of BLiPP
BLiPP is a measurement agent that runs on every GEMINI experiment node within your slice. Through a web interface and/or command line, you can configure BLiPP to collect both passive and active measurements from the given node. BLiPP retrieves its configuration from a central information store known as UNIS, the contents of which we update through the configuration interfaces. BLiPP will then store measurement data to a measurement store (MS) running on the GEMINI global node within your slice. Each measurement is associated with one or more "event types" that identify what metric(s) are collected for a given measurement. These event types are displayed in a drop down box next to the configured measurements with an option for graphing the collected data.
Configure BLiPP measurements
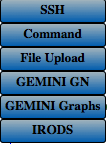
From the GENI Desktop page, click on the  and then select 'GEMINI GN' from
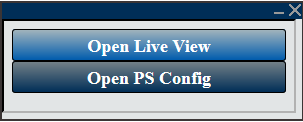
  . Select 'Open PS Config' from the new GN window:
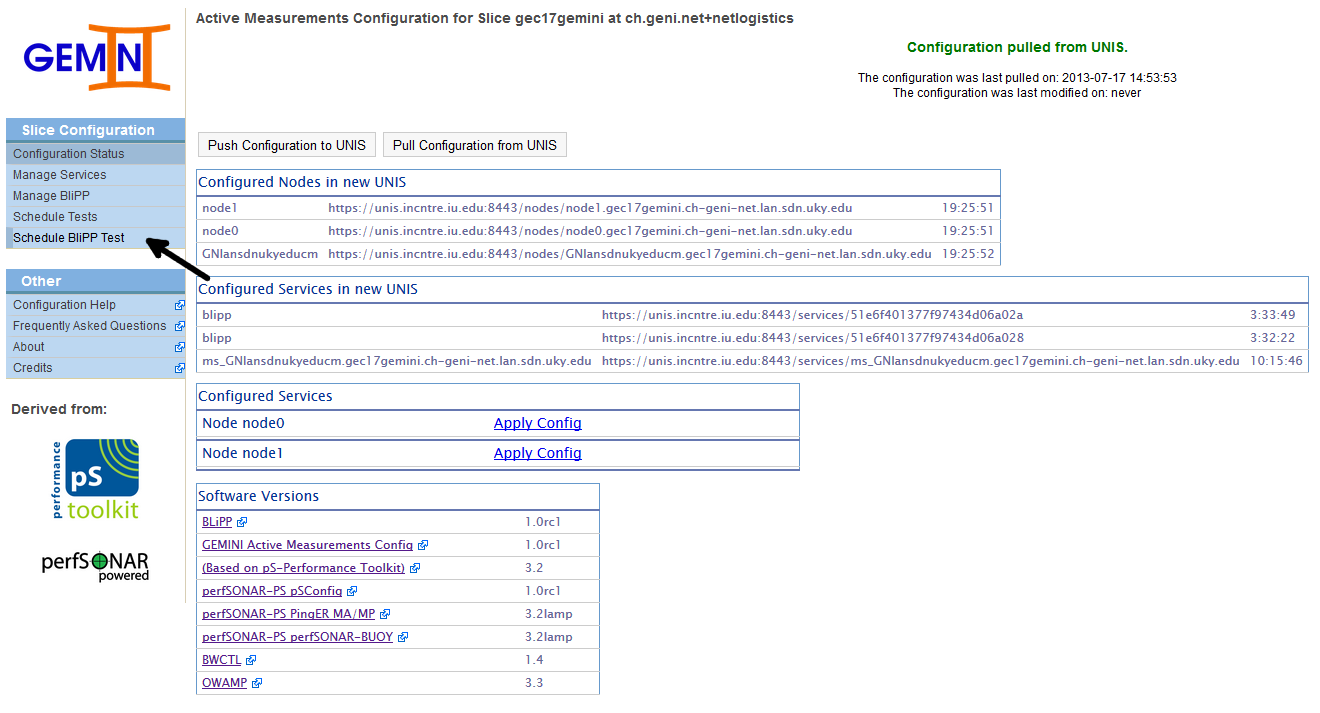
You should then see a page similar to the below image. Select 'Schedule BLiPP Test' from the menu.

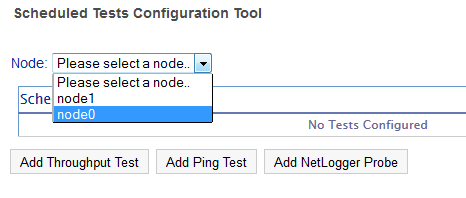
Select a node to configure from the dropdown menu  , then select an active test to configure.
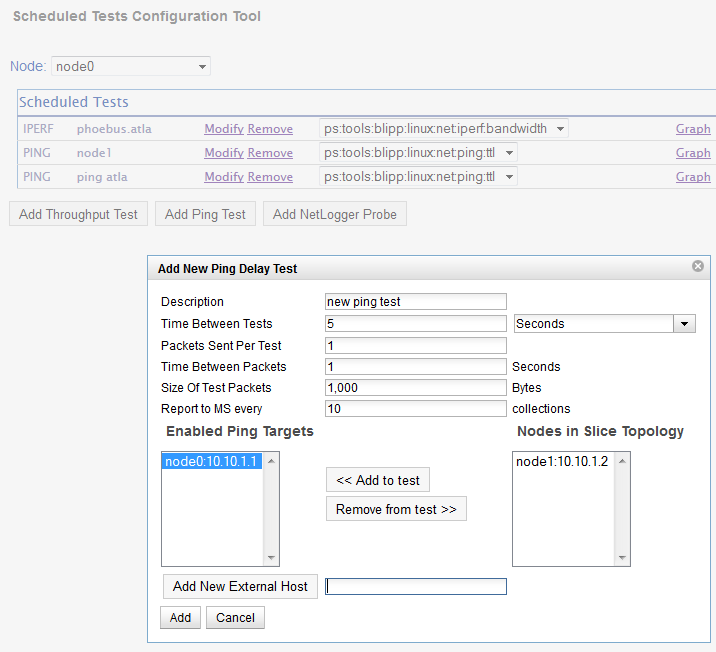
For example, below we configure a ping test. At the moment, only a single target may be configured per test. You can also add external hosts (i.e., outside of the slice) to ping by entering an IP or hostname in the text box.

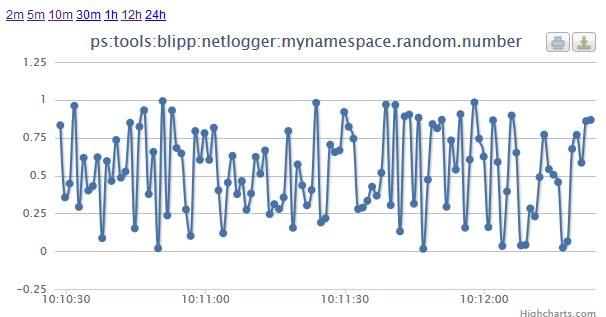
Once configured, BLiPP will poll UNIS, update its configuration, and begin collecting the desired measurements. The event types for each measurement will be displayed alongside each scheduled test row. Once data is available (give it a few minutes to begin collecting!), you can select an event type and display the associated graph.
Using NetLogger
NetLogger is a set of software tools that can be used to log application events and perform analysis and debugging of the collected log data. The python netlogger tools and libraries are installed on your slice nodes by default with GEMINI. More details and software can be obtained from the NetLogger website http://netlogger.lbl.gov/
An application instrumented with NetLogger can output log messages to a file in a standardized format. BLiPP has a netlogger probe that can parse this log file and report the measurements to the measurement store on your global node. In this way, measurement data collected from experiments in your slice will be in the same format as the other GEMINI measurements. This also means they are accessible in a common location and also archived to iRODS along with any other measurements collected through the GEMINI system.
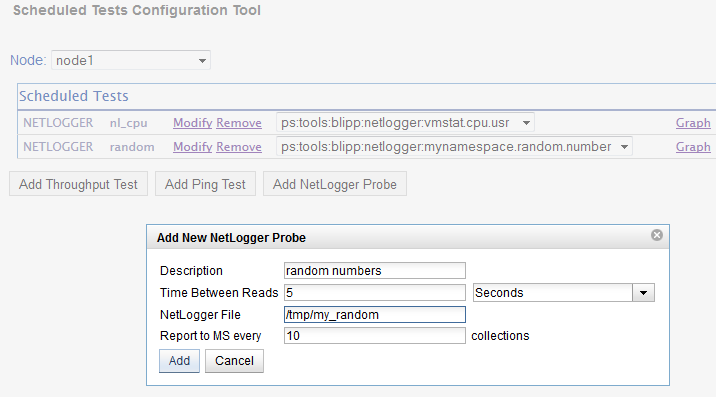
To configure a NetLogger probe, you simply add another BLiPP test as shown below.
Exercise Tasks
For the following exercise, if you do not have your own source code that you want to try, you can simply us the following HelloWorld.c program.
   main() {
      printf("Hello World\n");
   }
- Task 1: Do something.
- Task 2: Do something else.
Attachments (9)
- chart.png (55.7 KB) - added by 11 years ago.
- launcher.png (1.7 KB) - added by 11 years ago.
- launchermenu.png (19.1 KB) - added by 11 years ago.
- nl_probe.png (24.3 KB) - added by 11 years ago.
- ping_test.png (36.9 KB) - added by 11 years ago.
- psconfig.png (5.5 KB) - added by 11 years ago.
- psconfig_main.png (104.9 KB) - added by 11 years ago.
- select_node.png (8.1 KB) - added by 11 years ago.
- netlogger_test.py (398 bytes) - added by 11 years ago.
Download all attachments as: .zip